🌾 Welcome to StableBread’s Newsletter!
In a Morgan Stanley 2022 paper titled "Intangibles and Earnings," Michael Mauboussin explains a major problem with today's financial statements: Accounting rules treat physical and intangible investments differently, despite their similar economic purpose.
Mauboussin's solution is to capitalize (i.e., record as assets rather than expenses) intangible investments and amortize them over their useful lives—treating them exactly like physical investments. He found that this accounting adjustment increased earnings for the S&P 500 by 11.8% ($170B) in 2021.
In this post, we'll explain the accounting problem behind this distortion, examine how it affects different valuation methods, and show how capitalizing intangible investments provides a more accurate picture of company performance.
📜 Michael Mauboussin
Michael Mauboussin leads Consilient Research at Counterpoint Global, part of Morgan Stanley Investment Management. He previously worked at BlueMountain Capital, Credit Suisse, and Legg Mason Capital Management in research and strategy roles. Mauboussin has written three books, including "More Than You Know," which was named one of the 100 Best Business Books of All Time.
💻 Excel Model: Download this free Excel model to follow along: Adjusting for Intangibles - StableBread

The Accounting Problem
Financial statements are supposed to give investors the information they need to make investment decisions about a company. But a major shift from physical to non-physical investments has made these statements less useful than they once were.
There are two types of investments companies make to grow their business:
Tangible investments: Physical assets like factories, machinery, equipment, and vehicles.
Intangible investments: Non-physical assets like research, brand development, software, and customer relationships.
The problem, as Mauboussin observed, is that accounting rules treat these two types of investments very differently:
Tangible investments:
Recorded on the balance sheet as assets.
Depreciated over their useful lives.
Depreciation shows up as an expense on the income statement.
Intangible investments:
Immediately recorded as an expense on the income statement.
Only appear on the balance sheet if acquired (i.e., not created internally by the company itself).
Not systematically amortized unless acquired.
This creates a situation where intangible investments don't appear on the balance sheet like physical assets do, making financial statements less accurate in representing a company's true value.
How Accounting Distorts Company Value
Here's a simple example to illustrate why this matters:
Company A buys a $1,000 machine expected to last 5 years and generate $1,500 in value.
Company B spends $1,000 to acquire a customer expected to remain for 5 years and generate $1,500 in value.
Though these investments are identical in economic terms, their accounting treatment differs dramatically:
Company A records the machine as an asset and depreciates $200 annually for 5 years.
Company B immediately expenses the entire $1,000 as a selling cost.
As a result, Company B will show much lower profits in the current year, even though both companies made investments with the same expected return on capital.

Valuation Distortions From Intangible Accounting
This accounting inconsistency impacts three main valuation approaches in different ways:
Discounted Cash Flow
When investors use a discounted cash flow (DCF) model, they estimate the total cash a company will generate minus what it spends on investments.
In theory, DCF calculations remain unchanged because they consider both earnings and investments. Whether you expense or capitalize an investment, free cash flow (FCF) stays the same:
Traditional approach: Company earns $250 and invests $100, leaving $150 in FCF ($250 - $100).
Adjusted approach: Company earns $350 (higher because $100 was moved from expense to investment) and invests $200 (higher by the same $100), still leaving $150 in FCF ($350 - $200).
Despite the FCF remaining the same, understanding a company's true investment level helps investors better predict future growth potential.
Earnings Multiples
Popular valuation ratios like P/E and EV/EBITDA can be significantly distorted by how intangibles are treated.
In Mauboussin's paper, he analyzes Amazon ($AMZN ( ▼ 1.56% )) as an example. For FY2021:
Amazon's reported net income was $33.4B.
After reclassifying $60.1B of expenses as investments, net income increases to $61.5B ($33.4B + $60.1B - amortization of prior investments).
This adjustment nearly doubled Amazon's earnings, making its P/E ratio appear about 45% lower than currently calculated. This suggests Amazon was potentially undervalued compared to what investors believed in 2021.
Book Value Ratios
The P/B ratio compares a company's market value to its accounting book value. Book value represents a company's assets minus its liabilities—essentially what shareholders would theoretically receive if the company were liquidated.
P/B Ratio = Current Stock Price / Book Value Per Share
This ratio is directly affected by how we account for intangibles.
When intangible investments are immediately expensed, they never appear as assets on the balance sheet. This makes the book value artificially low, since these valuable investments aren't counted as assets despite creating real economic value.
According to Mauboussin's paper, this accounting issue has weakened the effectiveness of the "value factor" in investing.
Notably, Fama and French's (1993) research shows that the value premium (the excess return from buying stocks with low P/B ratios) has diminished as the economy shifted toward intangibles.
Mauboussin cites research showing that when book values are adjusted to include capitalized intangibles, the value factor's performance significantly improves because the adjusted book values more accurately reflect each company's true investment base.

Capitalizing Intangible Investments
Mauboussin's solution is to treat intangible investments the same way we treat tangible ones. In other words:
Identify which expenses on the income statement are actually investments.
Move these investments to the balance sheet (capitalize them).
Amortize them over their useful lives.
However, this raises two key questions:
Which expenses should be considered investments?
What's the appropriate useful life for these assets?
Identifying Investment Expenses
Approach #1: Standard Academic Method
According to Mauboussin, researchers often use rules like "100% of R&D plus 30% of non-R&D SG&A" as investments, and assume a standard asset life.
However, this approach is too general for accurate company-specific analysis, given that the investment component of SG&A varies widely by industry and company.
Approach #2: Maintenance vs. Growth SG&A
Mauboussin highlights research by accounting professors Luminita Enache and Anup Srivastava (2018) that separates SG&A expenses into:
Maintenance SG&A: Expenses needed to sustain current operations.
Investment SG&A: Expenses that pursue growth and create future value.
This framework establishes the conceptual foundation for identifying investment expenses within SG&A, but doesn't provide specific parameters for implementation across diverse industries.
Approach #3: Industry-Specific Analysis
Further research by Iqbal, Rajgopal, Srivastava, and Zhao (2021) analyzed 42 industries to determine:
What percentage of SG&A expense is an investment?
What is an appropriate asset life?
They separated SG&A into two components: Main SG&A (all SG&A expenses excluding R&D) and R&D expense.
Their findings show significant variation across industries:
The investment portion of Main SG&A (excluding R&D) ranges from 0% to 80%, with an average of 54%.
The investment portion of R&D ranges from 7% to 98%, with an average of 76%.
Useful lives for Main SG&A investments range from 0.25 to 5 years (average 3.3 years).
Useful lives for R&D investments range from 0.5 to 7 years (average 4.4 years).
These wide ranges show that a one-size-fits-all approach to capitalizing intangibles won't work across different industries.
Therefore, investors should use industry-specific percentages and asset lives when adjusting financial statements rather than applying general rules across all companies.
Growth's Impact on Adjustments
Beyond identifying what portion to capitalize, the difference between reported and adjusted earnings also depends on the growth rate of investment SG&A.
When a company's investment spending grows, the amount removed from current expenses exceeds the amortization added back from past investments.
For example, consider a company with $1,000 in SG&A where 30% is considered an intangible investment with a 3-year life:
If SG&A doesn't grow, eventually you'll be capitalizing $300 and amortizing $300, with no net effect.
If SG&A grows at 10% annually, you'll have a 5.1% net reduction in SG&A expense, increasing profits.
Here’s how the 5.1% is derived ($68 / $1,331):

Reduction in SG&A Expense Example
Overall, this explains why fast-growing companies benefit most from this accounting adjustment—their current investment spending outpaces the amortization of past investments.
Moreover, reclassifying expenses as an investment also boosts book value—assets increase, shareholders' equity rises, while liabilities stay the same. According to Iqbal et al., these adjustments can increase book value by 4-95% across industries (49% average increase).

Real-World Example
We’ll use Palantir Technologies ($PLTR ( ▼ 1.92% )) as our real-world example, a company that builds and deploys software platforms to assist in counterterrorism investigations and operations in the U.S., the U.K., and internationally.
Unlike manufacturers with physical equipment, Palantir's value comes mostly from intangible assets like software and customer relationships. Current accounting rules force them to expense these investments immediately, which may hide their true profitability.
Let’s examine how capitalizing intangible investments affects Palantir's financial performance using their FY2024 numbers (in millions of USD):
Step #1: Estimate Investment Portions
Based on Appendix A from Iqbal et al. (page 8 of Mauboussin’s paper), Palantir fits in the “Computers” industry category, which means:
66% of Main SG&A should be treated as investment with a useful life of 3.3 years.
80% of R&D should be treated as investment with a useful life of 4.4 years.
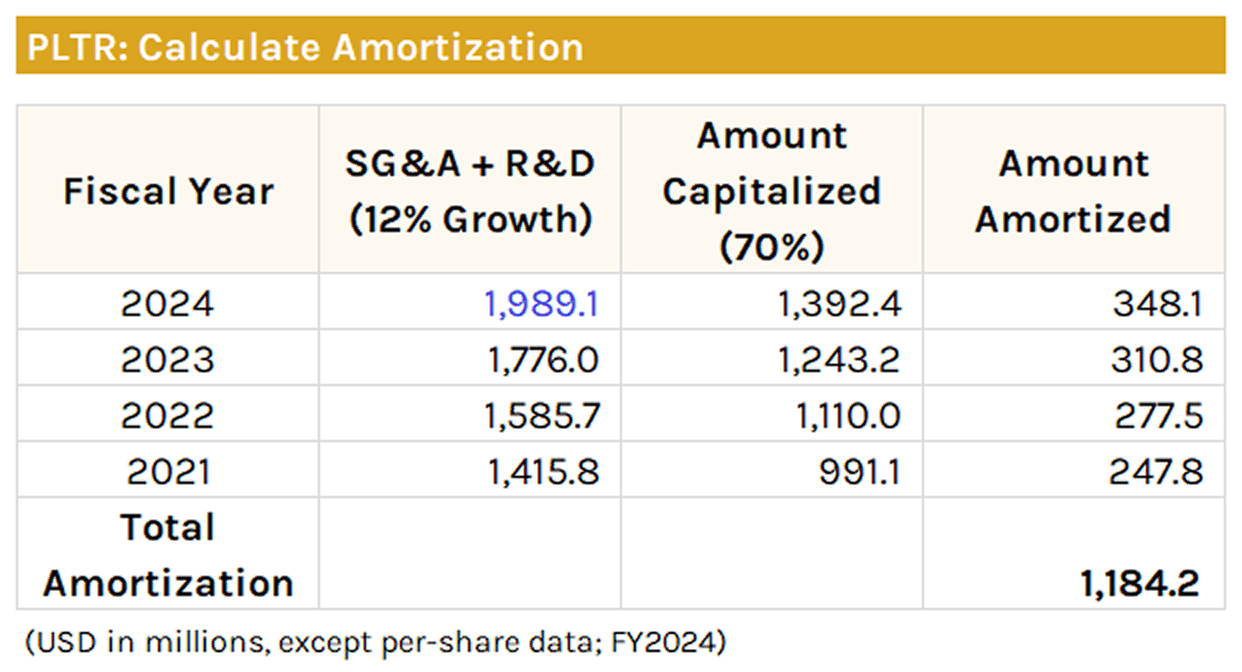
Using this research as a starting point, we estimate that 70% of Palantir's combined SG&A and R&D expenses should be capitalized with a useful life of 4 years.
Note: You could develop multiple scenarios by varying both the capitalization percentage (e.g., 60-80%) and/or useful life (e.g., 3-5 years) to establish a range of possible net adjustment figures rather than a single point estimate.
Step #2: Calculate Net Adjustment
For our analysis, we'll use a growth rate of 12% annually for the combined expenses. This is based on Palantir's historical performance, with SG&A growing at ~12.5% and R&D at ~10.5% per year.
Next, we need to compare what's capitalized now versus what's amortized from past investments:

PLTR: Calculate Amortization
Here’s how to calculate the net impact on profits:
Net Adjustment = Amount Capitalized - Total Amortization —>
$1,392.4M - $1,184.2M —> $208.2M
Step #3: Adjusted Results
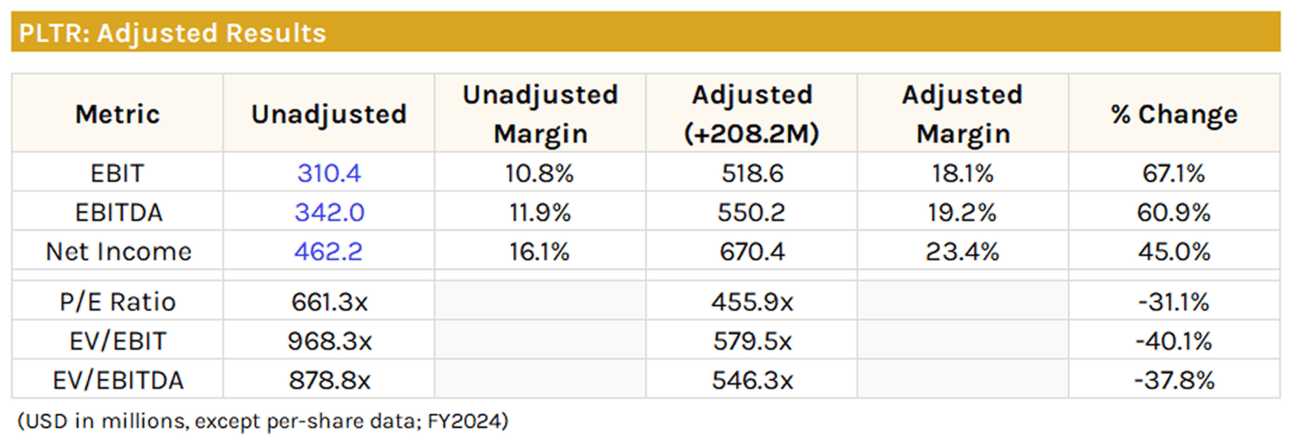
Finally, here's how these adjustments impact Palantir's key financial metrics, margins, and valuation ratios:

PLTR: Adjusted Results
Note: Table based on Market Cap of $305.66B, EV of $300.56B, and FY2024 revenue of $2,865.5M
By accounting for intangible investments properly, Palantir's operating margin increases from 10.8% to 18.1%—a 67% increase. This shows that standard accounting understates the company's profitability when it treats long-term investments as current expenses.
The adjusted valuation metrics show similar improvements, with Palantir's P/E ratio dropping from 661x to 456x and EV/EBITDA falling from 879x to 546x.
For investors, these adjustments reveal a company with better financial strength than the reported numbers show. The higher margins and lower valuation multiples suggest Palantir may be creating more value and might be more reasonably priced than what appears on the surface.

Thanks for Reading!

