In Partnership With Wisesheets
💹 StableBread’s Automated Stock Analysis Spreadsheet now offers a free version!
You can sign up to Wisesheets for free to start using the model (only AMZN, TSLA, and AAPL), or upgrade for only $60/year to access all stocks.
This spreadsheet will help you analyze more stocks and make quicker, more informed investment decisions, while avoiding the time-consuming task of building custom models or manually copy-pasting data—all at a fraction of the cost of traditional financial data providers.
🌾 Welcome to StableBread’s Newsletter!
The Earnings Quality Score (EQ Score) is an objective measure developed by Wolfe Research (in their 10-K Navigation Guide (2020)) that helps investors identify potentially underperforming stocks.
The model assumes that balance sheet and cash flow statements show early signs of income statement problems, and that management teams may use accounting maneuvers (e.g., cost capitalization, aggressively recognizing revenue, changing depreciation policies, etc.) to mask deteriorating business fundamentals (e.g., slowing revenue growth rate).
According to Wolfe Research, companies scoring below 10 often have questionable accounting practices that precede significant losses. In contrast, those scoring above 90 typically show clean accounting and cash flows that exceed reported earnings, which historically leads to above-average returns.
Related: Quality Score Articles
📜 Wolfe Research: Independent sell-side research firm based in New York, NY, founded in 2008. The firm employs a team of over 30 analysts and is well-known for its sector and macro research. They cover 750+ companies across over 100 industries.

EQ Score Explained
How the Scoring System Works
The EQ Score uses seven financial metrics, each equally weighted. All ratios are calculated on a trailing twelve months (TTM) basis, as Wolfe Research found this to be more predictive historically.
Companies are ranked within their sector for each metric, divided into ten groups (deciles) from 1 to 10. A score of 1 means the company ranks in the worst 10% for that metric, while 10 means it ranks in the best 10%.
The seven individual scores are added together, creating a raw score from 7 to 70. This raw score is then converted to a percentile rank within the sector, scaled from 0 to 100. A final EQ Score of 0 represents the worst earnings quality, while 100 represents the best.
Historical Performance
From 1990 to 2020 (30 years), Wolfe Research observed that companies in different EQ Score deciles showed distinct return patterns.
The worst performers were companies scoring 0 to 10, which underperformed by ~5-10% annually, depending on the sector. For example, in the technology sector, the bottom decile underperformed by nearly 10% per year, while in utilities it was closer to 5%.
Companies scoring above 90 showed the strongest performance, with similar levels of outperformance.
The model particularly excels at identifying companies to avoid, specifically those in the bottom 10% of earnings quality. The research found that both the highest and lowest deciles showed the most pronounced excess returns, suggesting the score works best at the extremes rather than for companies in the middle ranges.
The Seven Components
Here’s a table describing the seven EQ score components (read this closely):
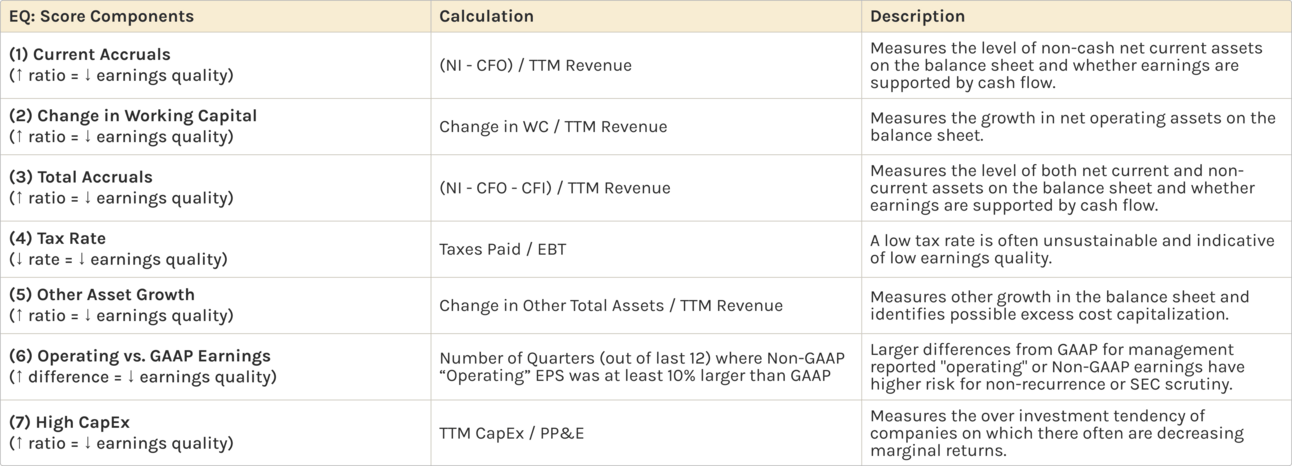
EQ: Score Components. Source: Wolfe Research. Table by StableBread
Note: We used six components instead of Wolfe Research's original seven for our example (below), removing the non-GAAP versus GAAP comparison since many companies don't report non-GAAP earnings and those that do use inconsistent metrics like basic EPS, diluted EPS, or FFO/share. This makes the model more accessible to retail investors, and although we may miss some aggressive accounting adjustments, we believe the remaining components can still identify companies with earnings quality issues.
Additional Negative Signals
To further identify companies with other negative signals, Wolfe Research qualitatively reviews additional factors.
While these factors are not explicitly included in the EQ Score because they are binary (yes/no) indicators rather than measurable ratios, their presence and frequency suggest lower earnings quality.
The more of these warning signs a company displays, the lower its overall earnings quality becomes.
Here's a table describing the additional EQ score components:
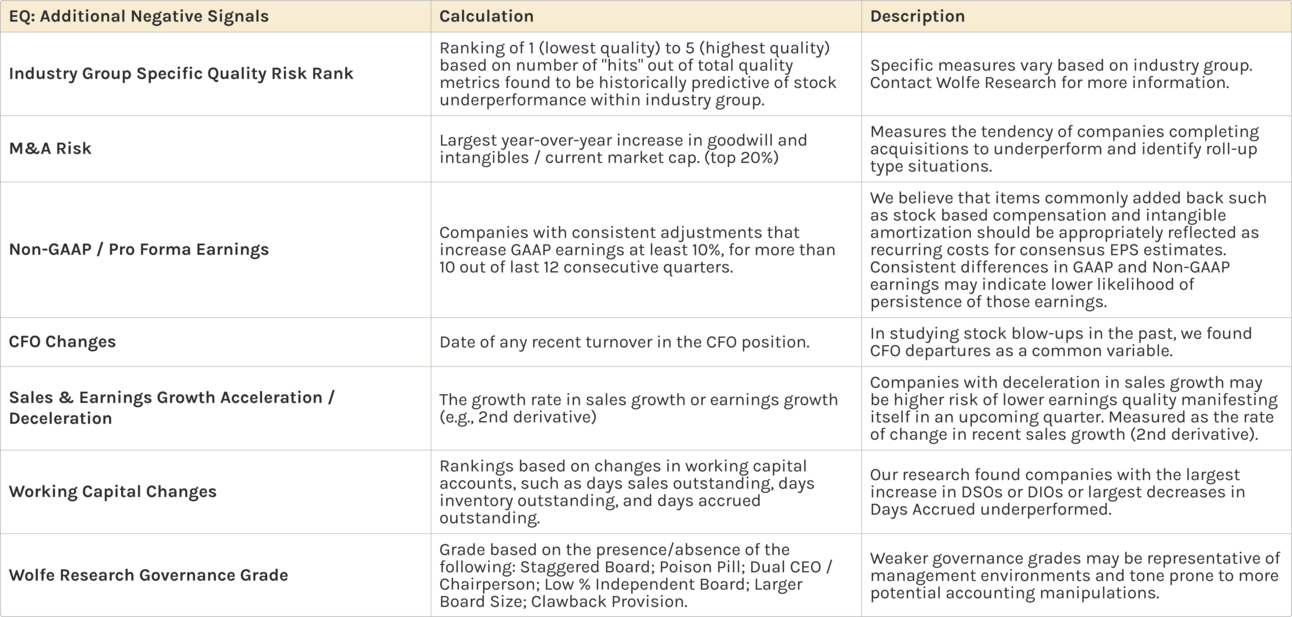
EQ: Additional Negative Signals. Source: Wolfe Research. Table by StableBread
Note: We excluded these additional negative signals from our example below because they are supplementary factors and more subjective in nature.

EQ Score Example
💻 Excel Model: Download this free Excel model to follow along: Earnings Quality (EQ) Model - StableBread
To apply the EQ Score, we selected Gas Utilities companies based in the U.S. that trade on NYSE or NASDAQ. This screening resulted in 13 companies.
Many online screeners let you filter by sector, country, and exchange. We used Fiscal.ai for this purpose.
After identifying our companies, we collected the following financial data for each company. We used Wisesheets to help speed up this data collection process:
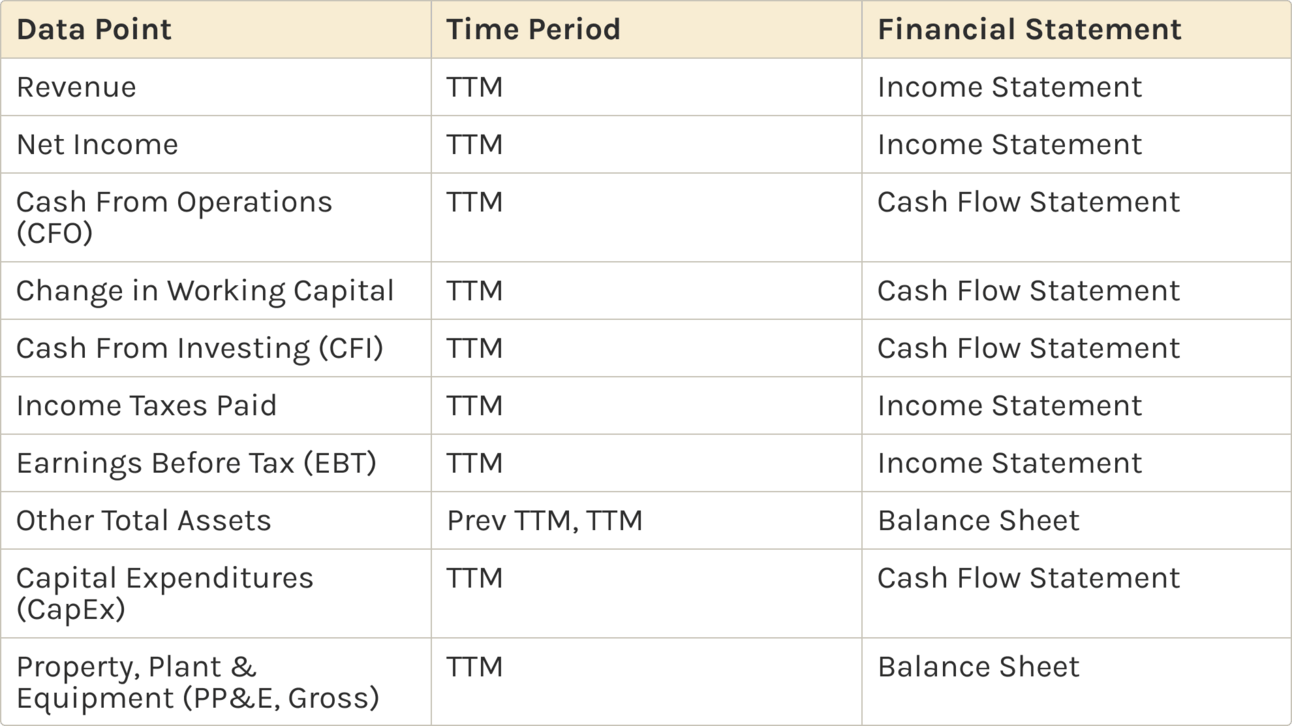
EQ Score Data Points
We then calculated all six EQ score components for each company, which produced the following results:
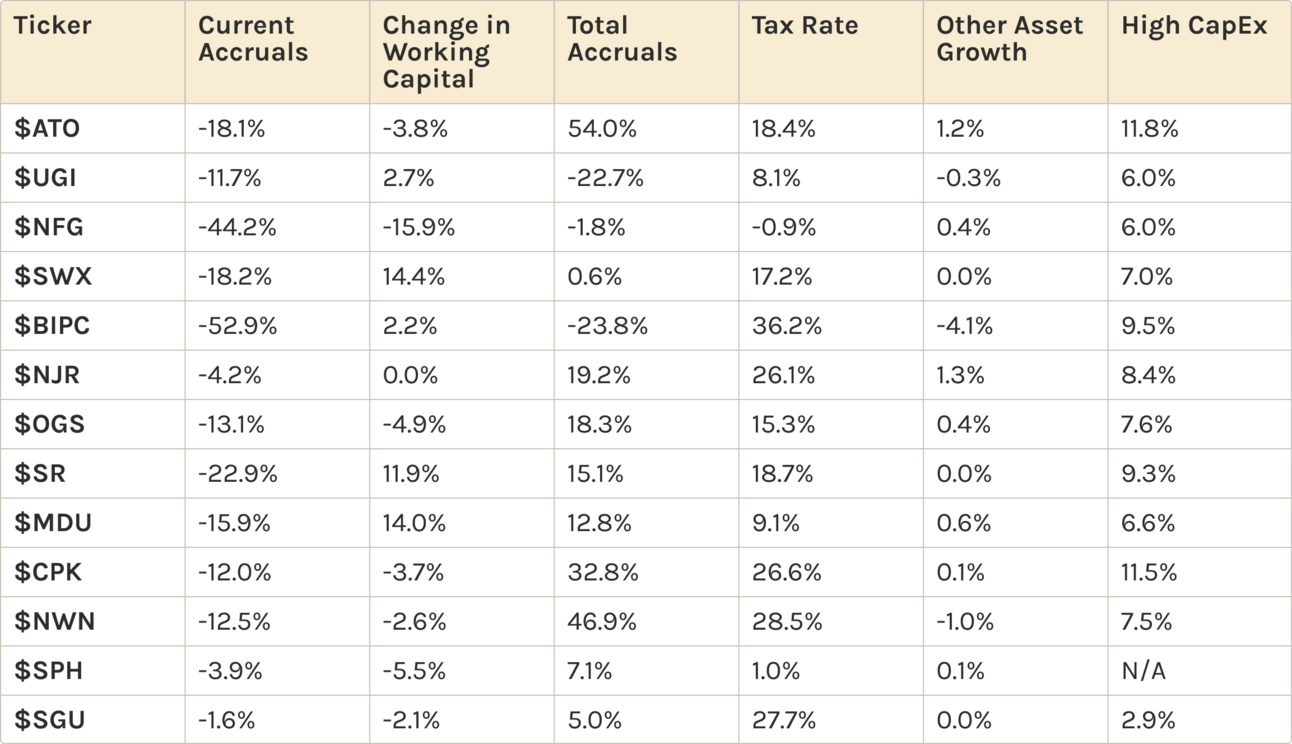
Components: Underlying Financial Ratios
Next, we ranked each component score using Excel's RANK.EQ formula. All components were sorted in descending order except the tax rate component, which we sorted in ascending order (lower tax rates indicate worse earnings quality).
After ranking all components from 1 to 13, we summed the scores across each row to get raw scores for every company.
Finally, we converted these raw scores to percentile ranks using Excel's PERCENTRANK.INC formula and multiplied by 100 to get the final EQ Score:
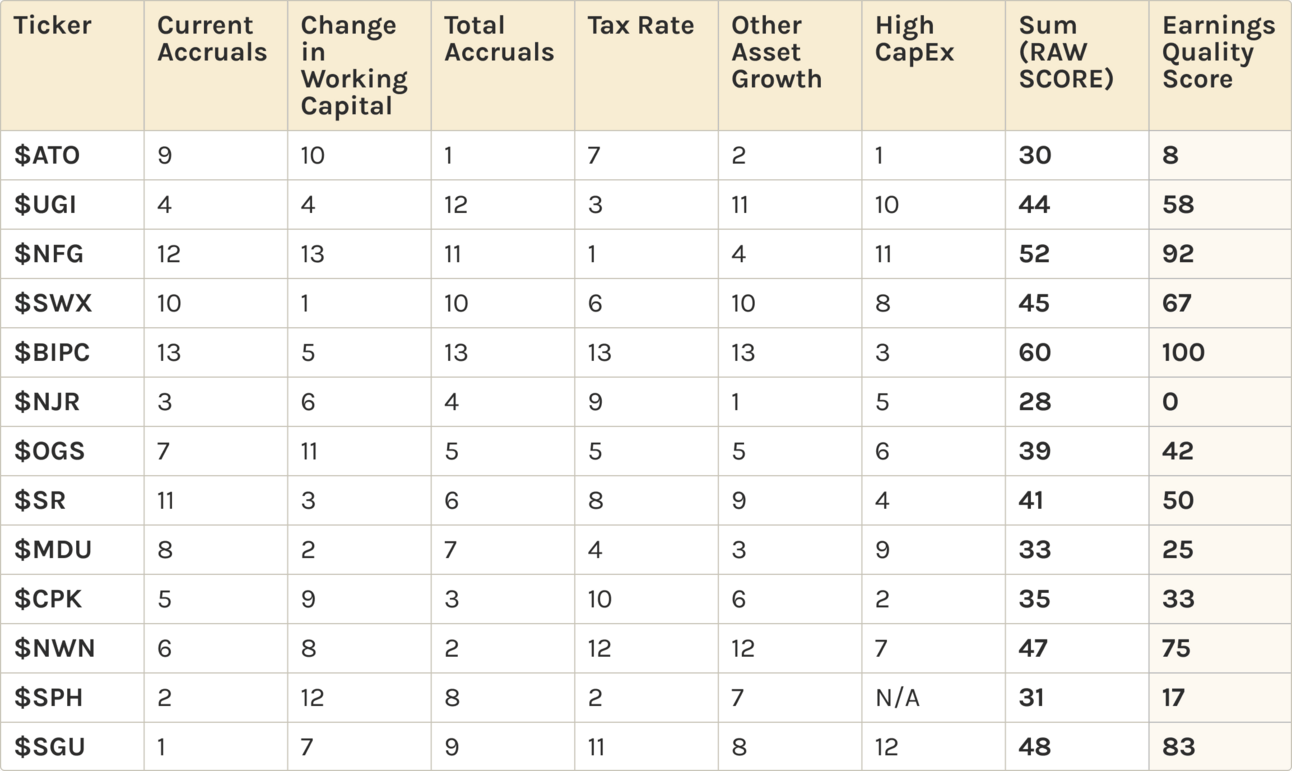
Individual Component Decile Ranks & Final EQ Score
Brookfield Infrastructure Corp ($BIPC ( ▼ 0.49% )) achieved the highest earnings quality score of 100. The company ranked first in 4/6 components (current accruals, total accruals, tax rate, and other asset growth). This indicates strong cash generation relative to reported earnings and sustainable tax rates.
New Jersey Resources Corp ($NJR ( ▲ 0.94% )) scored 0, the lowest in the sector. The company ranked poorly across most components, particularly in current accruals (3), total accruals (4), and other asset growth (1).
These low rankings suggest NJR's reported earnings significantly exceed its actual cash generation, a pattern that Wolfe Research's study found often precedes disappointing returns.
Note: These results would likely change if we included component #6 (requiring 12 quarters of non-GAAP and GAAP earnings data) or incorporated additional negative signals like recent CFO departures, which Wolfe Research found often precede stock declines.
Overall, the EQ Score serves as a starting point for identifying companies that deserve a closer look. High scores suggest potential opportunities worth exploring, while low scores raise questions that need answers before making any investment decisions.

Thanks for Reading!

