In Partnership With Fiscal.ai and Wisesheets
For stock research and screening, we use Fiscal.ai (use code “STABLEBREAD” to save 15%). It’s the most complete all-in-one research terminal we’ve found that’s accessible to the average retail investor.
For custom analysis and flexible valuation models, we use our Automated Stock Analysis Spreadsheet, powered by Wisesheets (the best spreadsheet add-on for stock data).
These are the two tools we use to analyze and value stocks more effectively and reach quicker, more informed investment decisions. Both have free versions if you want to try them out.
🌾 Welcome to StableBread’s Newsletter!
In The General Theory of Portfolio Construction (2024), Charles Gave presents an investment framework he developed in 1978 after watching Nixon break the gold standard and financial markets descend into chaos.
Now 81, Gave has refined his four quadrants model through five decades of market cycles, offering an approach to asset allocation that depends on just two variables: (1) economic activity and (2) price trends.
Gave observed that economies cycle through four distinct environments, and each environment favors different assets. Get the environment right, and you know what to own. Get it wrong, and you’ll struggle with generating outsized returns.
📜 Charles Gave: Started his financial career at Banque de Suez in 1970, then built a money management firm that grew to $10 billion AUM before selling it to Alliance Capital in 1995. In 2000, he co-founded Gavekal Research on the belief that China would transform into a major force in global markets, a prediction that proved accurate.

Four Quadrants Framework
The visual below describes the four quadrants framework:

Four Quadrants Framework | Recreated by StableBread
The horizontal axis measures economic activity, whether businesses are expanding or contracting.
The vertical axis tracks prices, whether we’re experiencing inflation or deflation.
This creates four quadrants, each representing a distinct economic environment.
Deflationary Boom (Bottom Right)
Gave defines deflationary boom as "the natural state of capitalism" where entrepreneurs figure out how to produce more goods and services using fewer resources, whether through technology, better processes, or innovation.
This efficiency means production volumes rise while prices fall, with businesses passing savings to consumers.
In this environment, innovative companies with pricing power thrive because they can maintain margins through differentiation, while companies without pricing power struggle as general price levels decline.
Beyond individual stocks, most long term investments perform well in this quadrant, including bonds and real estate, since economic growth combined with stable or falling prices makes future income streams more valuable.
For context, the 1990s tech boom and the 2010s expansion both occurred in this quadrant.
Inflationary Boom (Top Right)
Wars, massive infrastructure projects, or a rapid rise in government spending as a share of GDP push both prices and economic activity higher.
In this environment, stores of value dominate returns, including gold, commodities, real estate, and high fixed cost cyclical producers. Value managers and emerging market managers also tend to perform well during these periods.
Companies with high fixed costs particularly benefit as inflation reduces their debt burden while revenues rise with prices. In contrast, bonds suffer terribly, as rising yields fail to compensate for the erosion of their fixed payments.
The 2000s embody this quadrant when China's growth drove commodity demand higher while central banks kept rates low.
Inflationary Bust (Top Left)
Stagflation represents the investor's nightmare. Prices rise while the economy contracts. "Very few assets do well," Gave writes. "Long duration assets do especially poorly."
Economies often get pushed into stagflation through energy price spikes. When this happens, you should own cash in the safest currency, since even bonds collapse, and usually energy positions since they're often driving the inflation.
Gave also advises selling financial assets because they suffer in stagflation. Earnings collapse, dragging down stock prices, while inflation eats away at bond values.
The 1970s oil shocks created the most famous inflationary bust, with oil prices quadrupling, inflation hitting double digits, and the economy falling into recession. Cash and energy positions provided the only protection.
Deflationary Bust (Bottom Left)
Both prices and sales volumes fall in this environment. Companies cannot repay the principal of their debt, bankruptcies surge, and asset prices collapse across the board.
Only long dated government bonds rise as investors flee to safety and interest rates plummet.
In 2008, long Treasuries returned over 20% while stocks halved. Corporate bonds collapsed alongside equities as credit spreads exploded. Real estate crashed. Commodities plummeted. Gold initially fell before recovering.
Government bonds became the only winning trade as the Fed slashed rates to zero and investors sought safety above all else.

Identifying Your Quadrant
Gave spent decades searching for reliable indicators to identify which quadrant the economy occupied.
The problem was that official economic data arrives late and gets revised, while market prices reflect emotion as much as fundamentals.
His solution was to let market relationships themselves provide the signals.
Boom or Bust?
First, Gave recognized that "the economy is nothing but energy transformed." This means that economic output depends on how efficiently businesses convert energy inputs into goods and services.
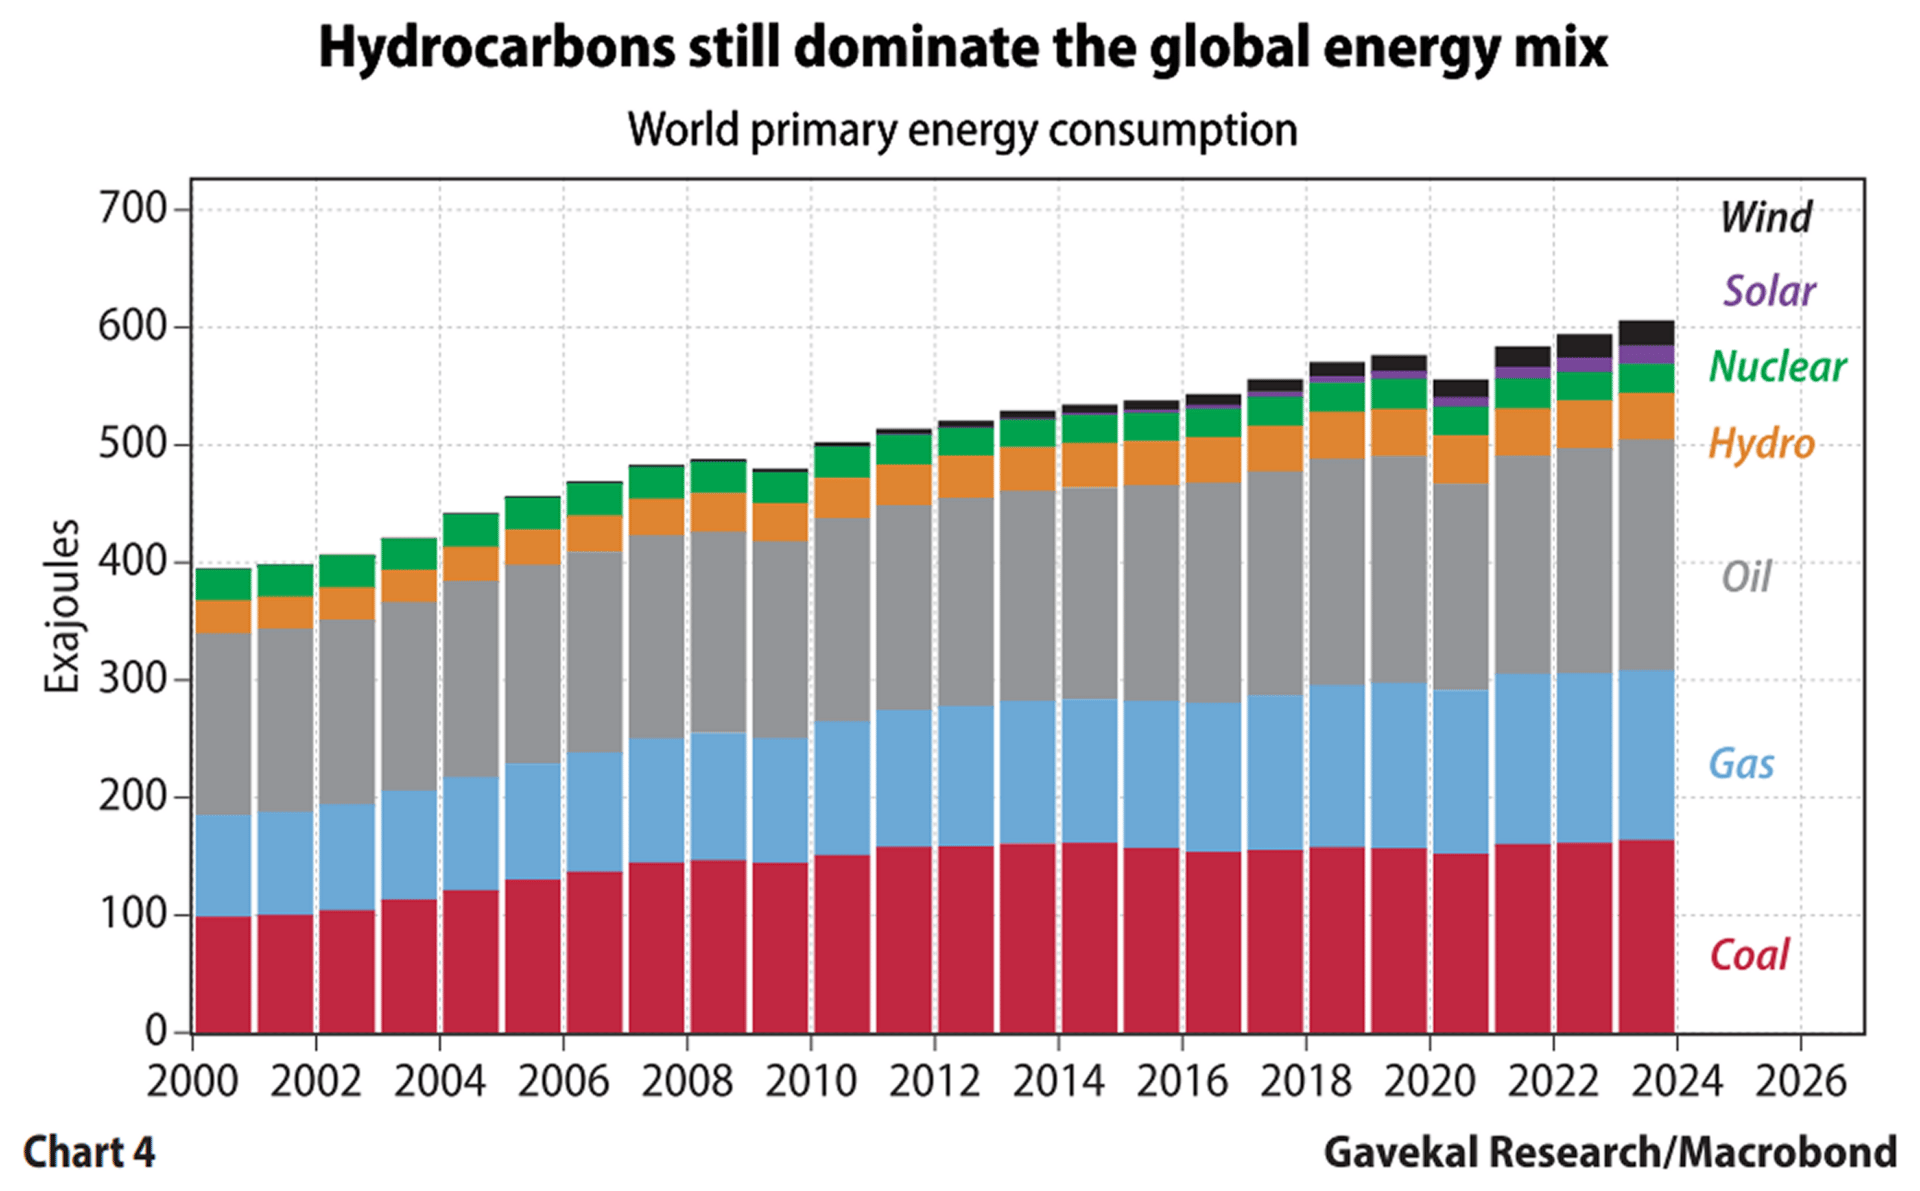
~80% of the energy consumed in the world comes from fossil fuels such as coal, oil, and natural gas:
Source: Gavekal Research/Macrobond
The concept is simple:
When businesses extract more value from each unit of energy, the economy expands.
When energy costs overwhelm the value businesses can create, contraction follows.
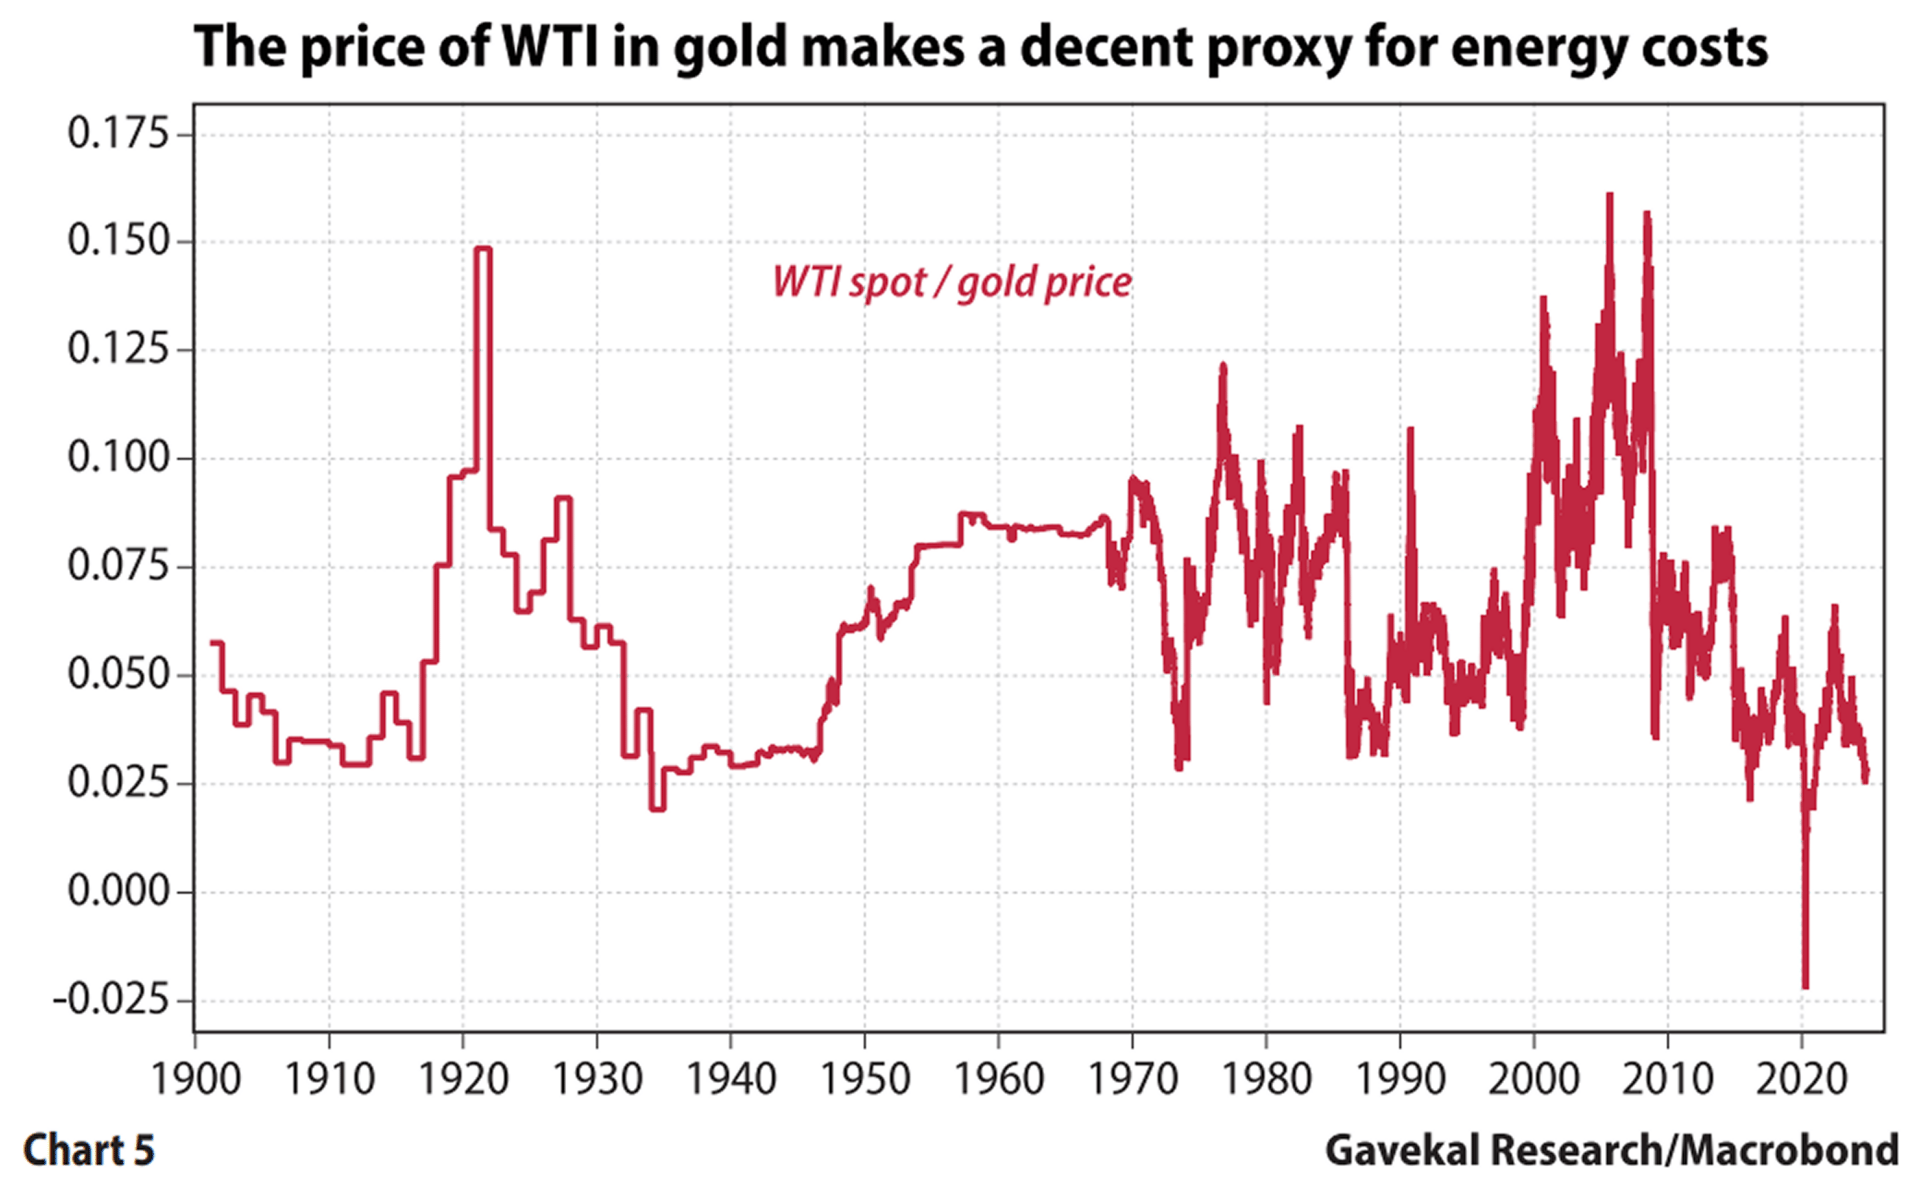
For measuring energy costs, Gave looks at the WTI (oil price) in gold terms (WTI/Gold), which provides a proxy of energy costs over time:
Source: Gavekal Research/Macrobond
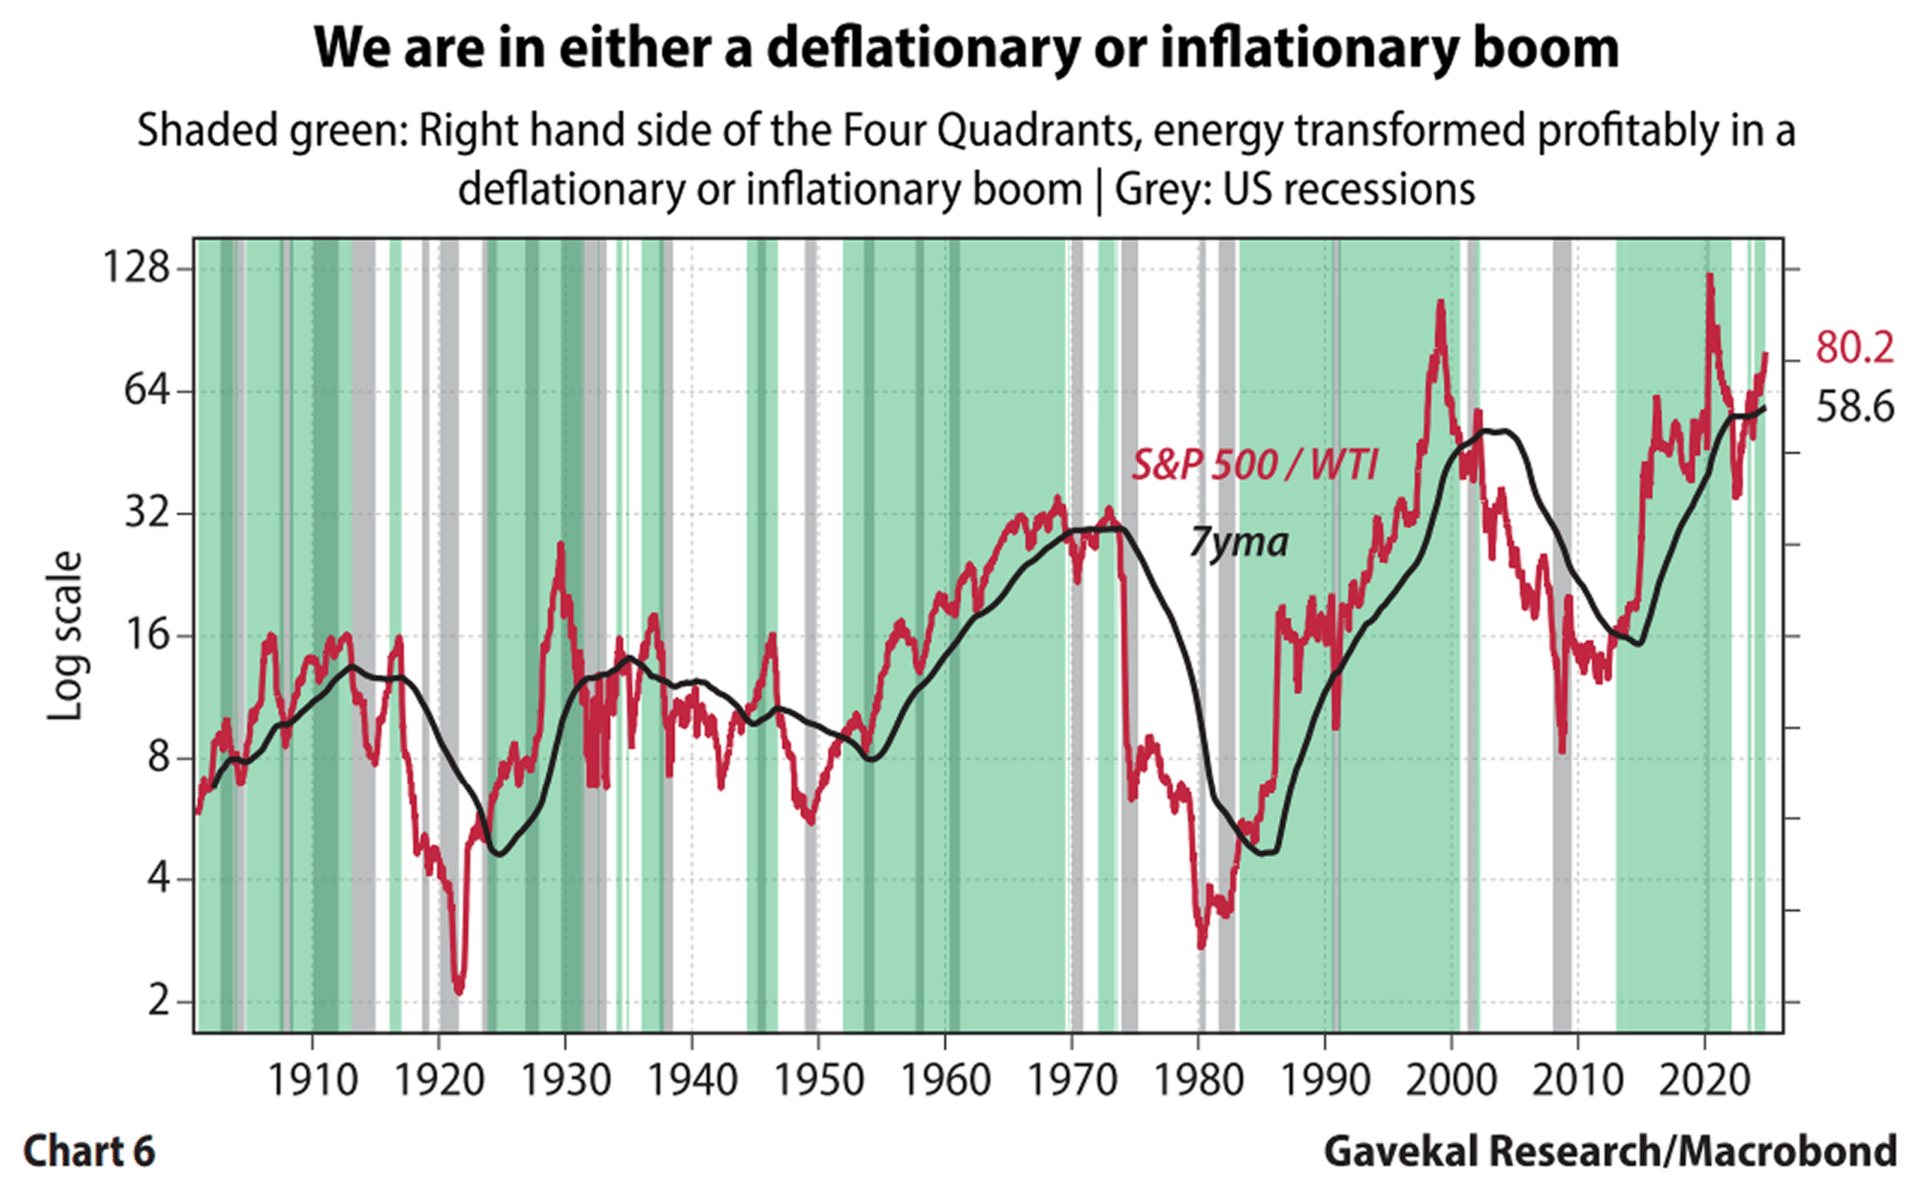
But to determine which quadrant investors are in, he uses the S&P 500 to WTI ratio (S&P 500/WTI), a proxy measure for energy efficiency.
Since S&P 500 companies represent most of the private sector's economic activity, their combined value serves as a proxy for what the economy produces. WTI prices represent the cost of energy needed to run factories, transport goods, and power offices.
Gave tracked this relationship over more than a century to show how the ratio predicts economic expansions and contractions:
Source: Gavekal Research/Macrobond
Here’s the rule to determine whether you're on the right or left side of the four quadrants:
When S&P 500/WTI sits above its seven-year moving average (chart shaded green), you're on the right side of the quadrants, in either a deflationary or inflationary boom.
When S&P 500/WTI sits below its seven-year moving average (chart unshaded), you're on the left side, in either a deflationary or inflationary bust.
We created a chart tracking the S&P 500/WTI, as pictured below (see web post for interactive chart):
As of Sept. 30, 2025, the S&P 500/WTI ratio stands at 107.07, above its seven-year SMA of 99.33. This places investors on the right side of the quadrants, signaling boom conditions.
Inflation or Deflation?
For years, Gave tried to model future inflation using:
The Phillips Curve, showing the relationship between employment and inflation, worked sometimes but failed other times.
Rising energy prices drove inflation in some periods but had no effect in others.
Big budget deficits meant higher inflation in certain cases, but not in Japan during the 1990s and 2000s.
Gave then realized what mattered wasn't whether prices were accelerating, but whether the bond market was protecting investors against rising prices. He wanted to know: were long-dated US treasuries a proper store of value?
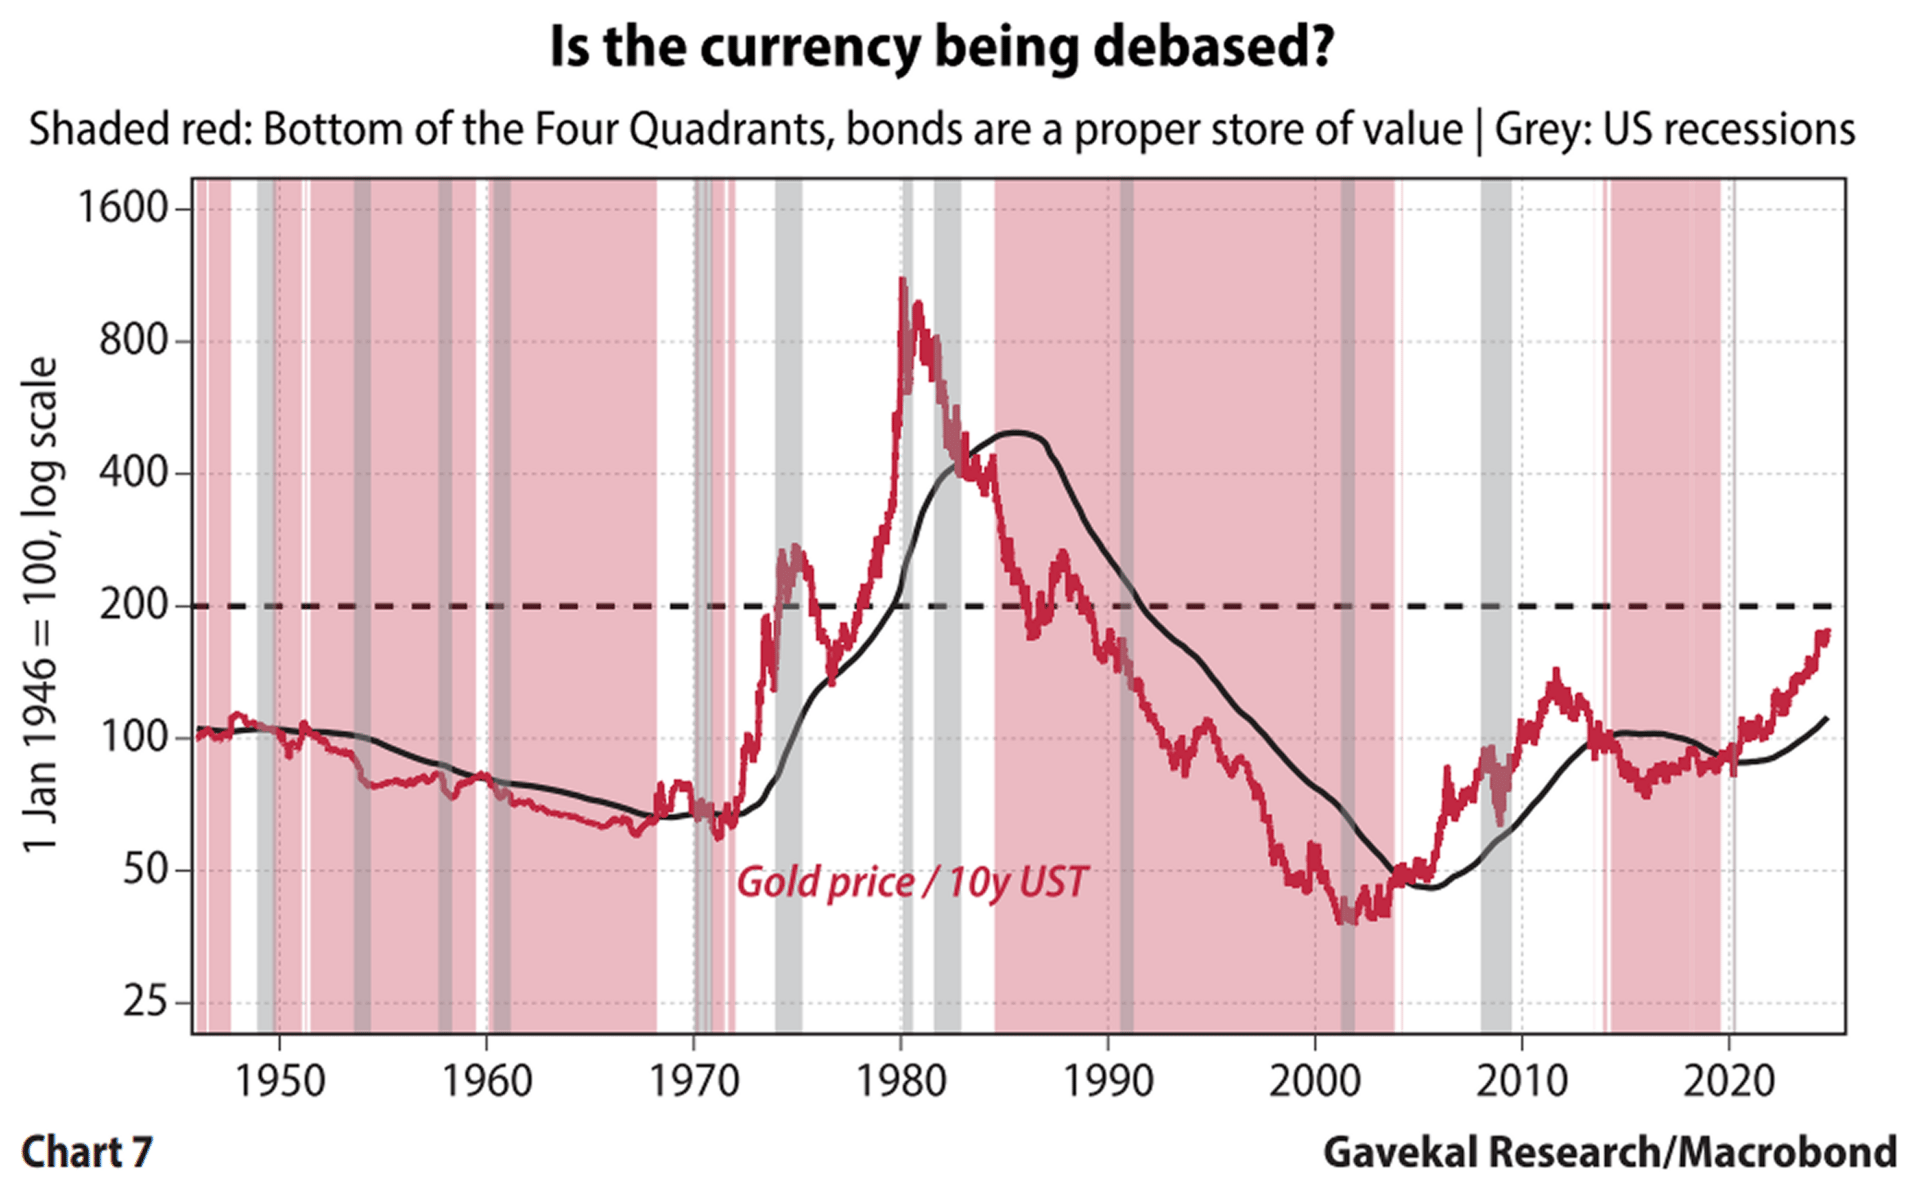
To answer this, Gave uses gold as a standard of value and computes the ratio between gold prices and 10-year Treasury total returns (Gold/US10YT):
Source: Gavekal Research/Macrobond
Here's how to determine whether you're in the top or bottom half of the quadrants:
When Gold/US10YT sits below its seven-year moving average (chart shaded red), bonds are outperforming gold and serving as a proper store of value. This places investors in the bottom two quadrants (deflationary boom or deflationary bust).
When Gold/US10YT rises above its moving average (chart unshaded), gold is outperforming bonds, signaling currency debasement. This places investors in the upper two quadrants (inflationary boom or inflationary bust).
Related: How Gold Works as a Portfolio Hedge
We also created a chart tracking gold relative to Treasury bonds using IEF (Gold/IEF), the iShares 7-10 Year Treasury ETF (again, see web post for interactive chart):
Since 10-year Treasury total return data is difficult to access for retail investors, IEF serves as a suitable proxy. It captures both bond price changes and interest payments, closely approximating the total return measure Gave uses.
As of Sept. 30, 2025, the Gold/IEF ratio stands at 40.05, above its seven-year SMA of 36.54. This indicates gold is outperforming bonds, signaling currency debasement and placing investors in the top half of the quadrants.
Combined with the SPX/WTI signal showing boom conditions, investors are currently in an inflationary boom quadrant. This environment favors real assets like gold, commodities, and real estate over bonds.
Refining the Axes
Having discovered that these two ratios (S&P 500/WTI and Gold/US10YT) effectively identify quadrant positions, Gave realized the original axes, "economic activity" and "prices," were too vague.
What the ratios actually measure is far more specific: (1) energy efficiency and (2) currency quality. So, for the first time since establishing the four quadrants in 1978, Gave renamed the axes to reflect these measures:

Energy and Currency Matrix | Recreated by StableBread
The horizontal axis now tracks "energy efficiency" vs. "energy inefficiency." The vertical axis shows "good currency" vs. "bad currency."
The four investment environments and what to own in each haven't changed, but now each gets a score based on combining the two ratios:
Energy efficient with good currency (+1 + 1 = +2): Deflationary boom where capitalism thrives, the best environment for investors.
Energy inefficient with bad currency (-1 - 1 = -2): Inflationary bust, the worst scenario where very few assets perform well.
Energy efficient with bad currency (+1 - 1 = 0): Inflationary boom, a mixed environment favoring real assets.
Energy inefficient with good currency (-1 + 1 = 0): Deflationary bust where making money is very challenging, another mixed environment.
As of Sept. 30, 2025, we find ourselves in scenario three: an inflationary boom (as previously discussed), scoring +1 for energy efficiency but -1 for currency debasement, netting to zero. This mixed environment suggests favoring real assets over bonds and cash.
S&P 500 to Gold Ratio
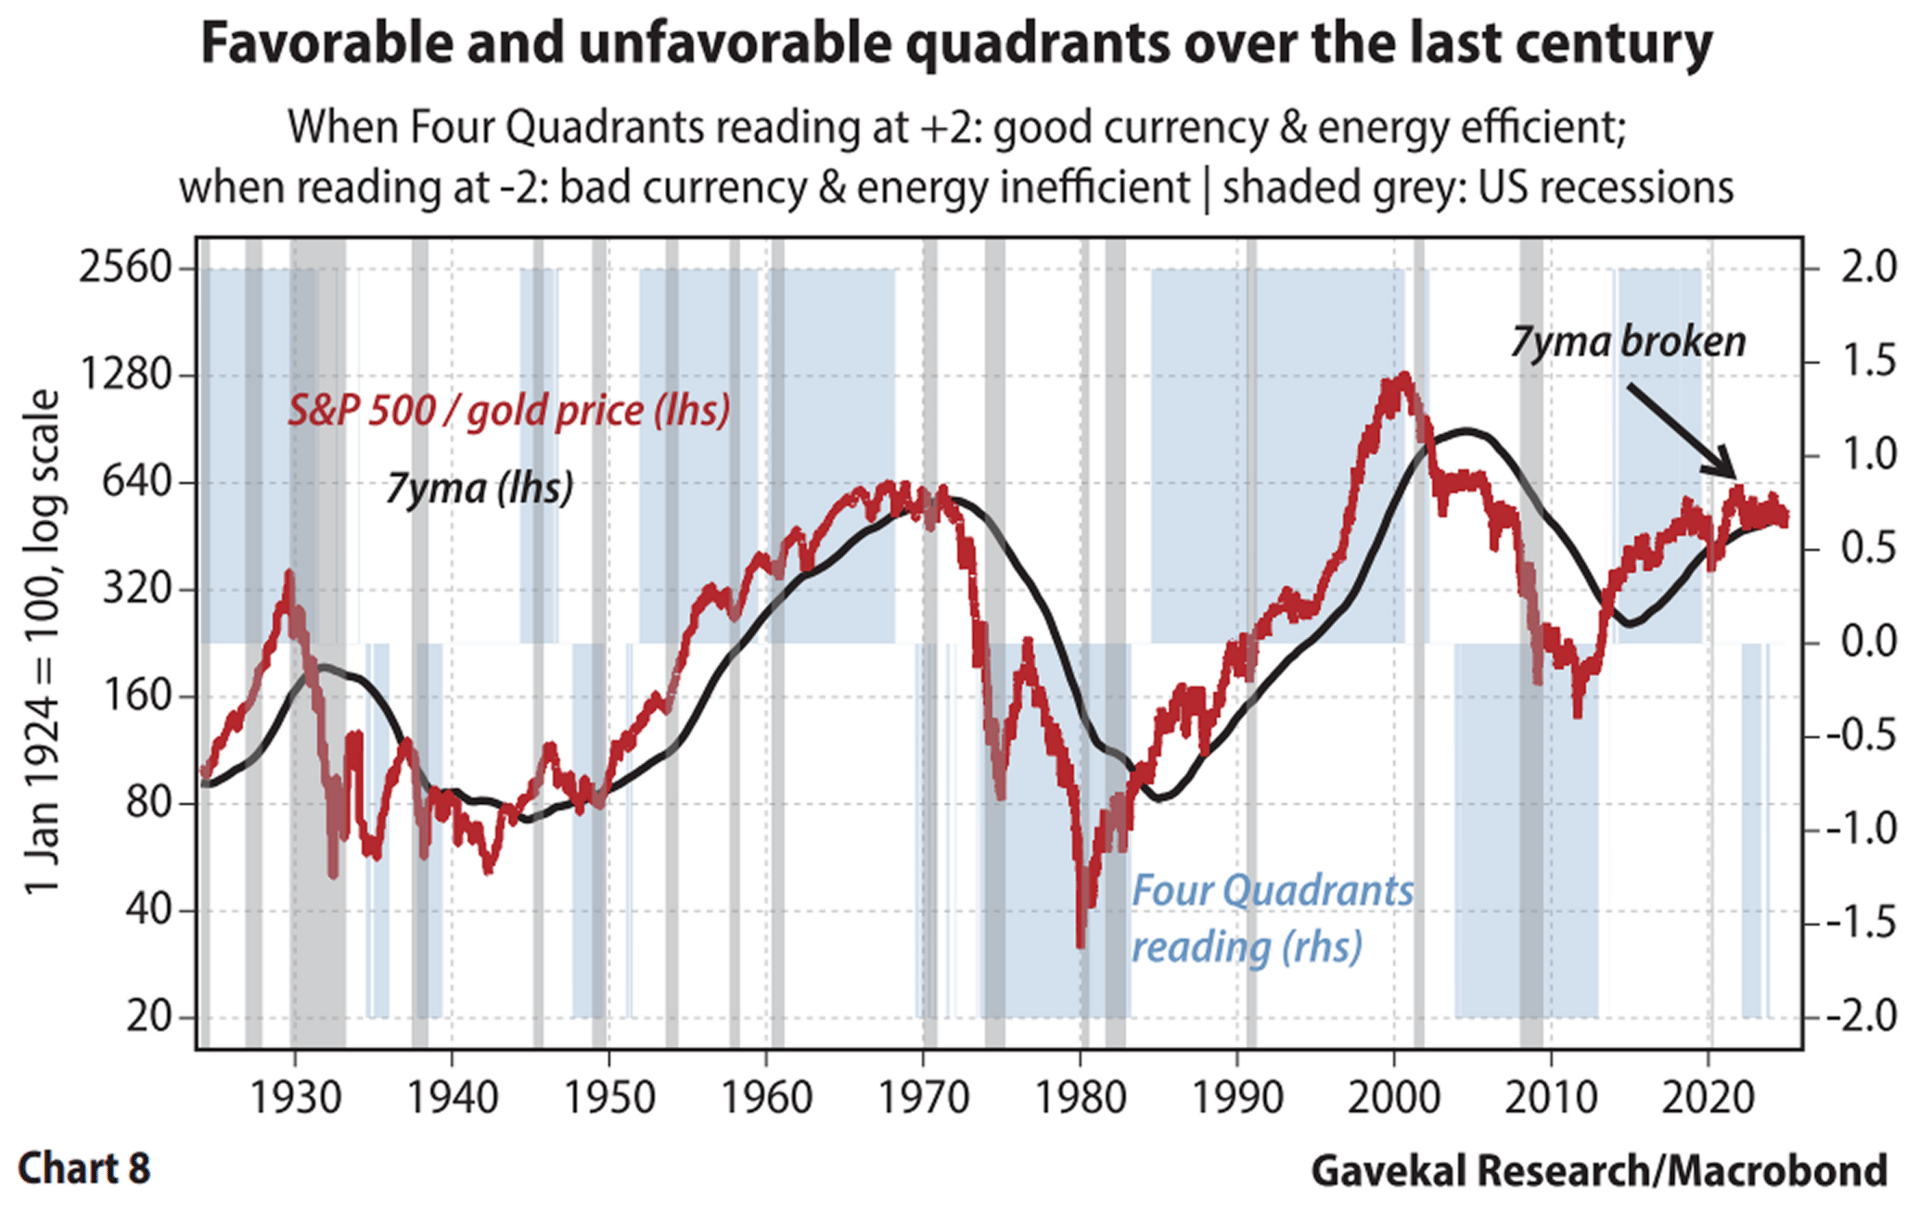
Gave then combined these quadrant readings with the S&P 500 to gold ratio (S&P 500/Gold) to see how different economic environments performed over the past century:
Source: Gavekal Research/Macrobond
The results show a clear pattern:
All true US bull markets, when stocks outperform gold over time, have taken place in the bottom right quadrant (deflationary boom).
All major bear markets, what Gave calls the "Ursus magnus variety" that destroy capital, have occurred in the upper left quadrant (inflationary bust).
When the economy sits in the upper right (inflationary boom) or lower left quadrants (deflationary bust), nothing too dramatic tends to happen.
Note: Gave recommends buying setbacks in the S&P 500 during deflationary booms (bottom right), even those caused by recessions. These dips are opportunities. But sell any rallies during inflationary busts (upper left). Those bounces won't last.
Gave also observes that when S&P 500/Gold falls below its seven-year moving average, this has often preceded the same in S&P 500/WTI by a few months. This provides early warning that energy efficiency may soon deteriorate, potentially shifting the economy from boom to bust.
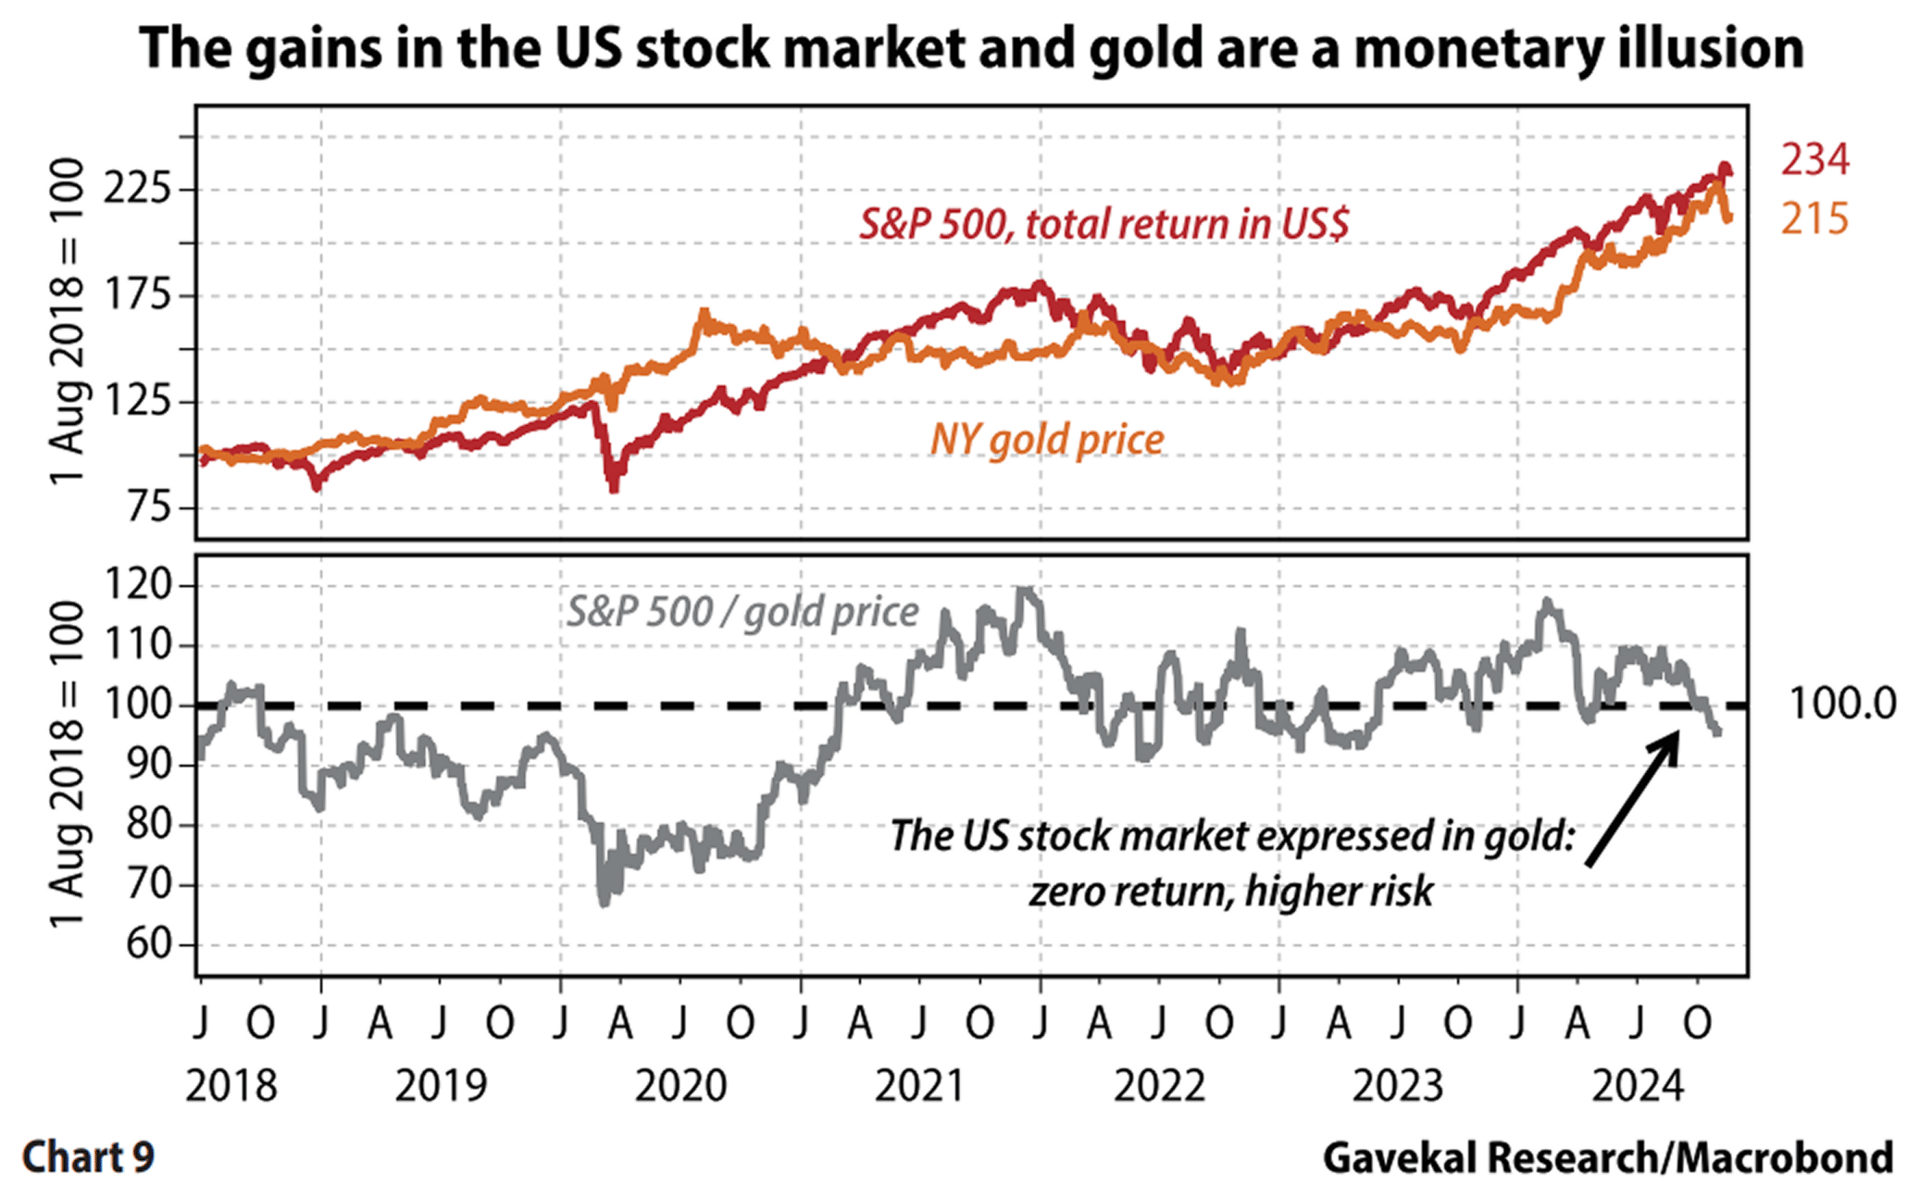
Interestingly, since 2018, both stocks and gold have posted similar gains, which represents what economists call "monetary illusion." As Gave puts it, neither asset has actually risen; the gains simply reflect US dollar currency debasement:
Source: Gavekal Research/Macrobond
After 54 years in markets, Gave concludes that success comes not from predicting the unpredictable but from recognizing which economic environment you're in and positioning accordingly.
No single strategy works in all environments. However, those who recognize the quadrant shifts and adapt their portfolios can prosper through each cycle.
While this post covers Gave's four quadrants framework and how to identify your current position, read the book to learn additional portfolio strategies not discussed here:
Specific switching rules between defensive and growth assets: Exact signals for when to rotate from cash and bonds into stocks and commodities based on the two ratio crossovers.
How currency debasement affects international portfolios: Why the declining US dollar monopoly means investors need to consider gold priced in multiple currencies, not just dollars.
Performance backtesting from 1971 to 2024: Detailed returns for different portfolio combinations across each quadrant, showing which strategies survived various crises.
These additional insights and data help turn the four quadrants concept into a realistic investment approach.

Thanks for Reading!
StableBread Resources
DCF & DDM Courses: Get lifetime access to 13h 25m of video content (82 videos), 22 Excel models, and 175 PDF slides.
Spreadsheets: Login to the customer dashboard (with your email) to access 60+ Excel models.
Articles: Read 100+ in-depth guides on stock analysis, stock valuation, and portfolio management.
Newsletter Posts: Browse 40+ newsletter posts, where we share specific teachings from successful value investors.
Investors: Visual and list of 50+ investors who beat the S&P 500 Total Return Index over an extended period of time.
Finance & Investment Calculators: Accelerate the stock analysis and valuation process with 150+ web-based calculators.

