📑 New Article: Learn about the Mohanram G-Score, a financial analysis model used to identify potential winners and losers among growth stocks (i.e., low book-to-market firms). Read it here.
🌾 Welcome to StableBread’s Newsletter!
In "The Five Keys to Value Investing" (2003), J. Dennis Jean-Jacques presents three approaches for evaluating businesses:
Vertical assessment: Analyzes each line item of the income statement from revenue to net income, revealing what drives profitability at every level.
ROE decomposition: Breaks return on equity (ROE) into profit margins, asset efficiency, and leverage to identify sources of shareholder returns.
Cash flow analysis: Examines actual cash generates versus accounting profits to assess true business quality.
Using all three approaches helps spot red flags that single metrics miss, like companies with high returns but weak cash generation, or strong margins hiding operational inefficiencies.
📜 J. Dennis Jean-Jacques: Founder and CIO of Ocean Park Investments, with over 20 years of experience investing more than $3.2B in US and European public markets. Previously served as Managing Director at Verition Fund and worked at Mutual Shares. Jean-Jacques holds an engineering degree from Boston University and an MBA from Harvard Business School.

Vertical Assessment Approach
The vertical assessment approach follows the structure of a company's income statement from top to bottom. This method evaluates each line item to understand what drives profitability at every level of the business.
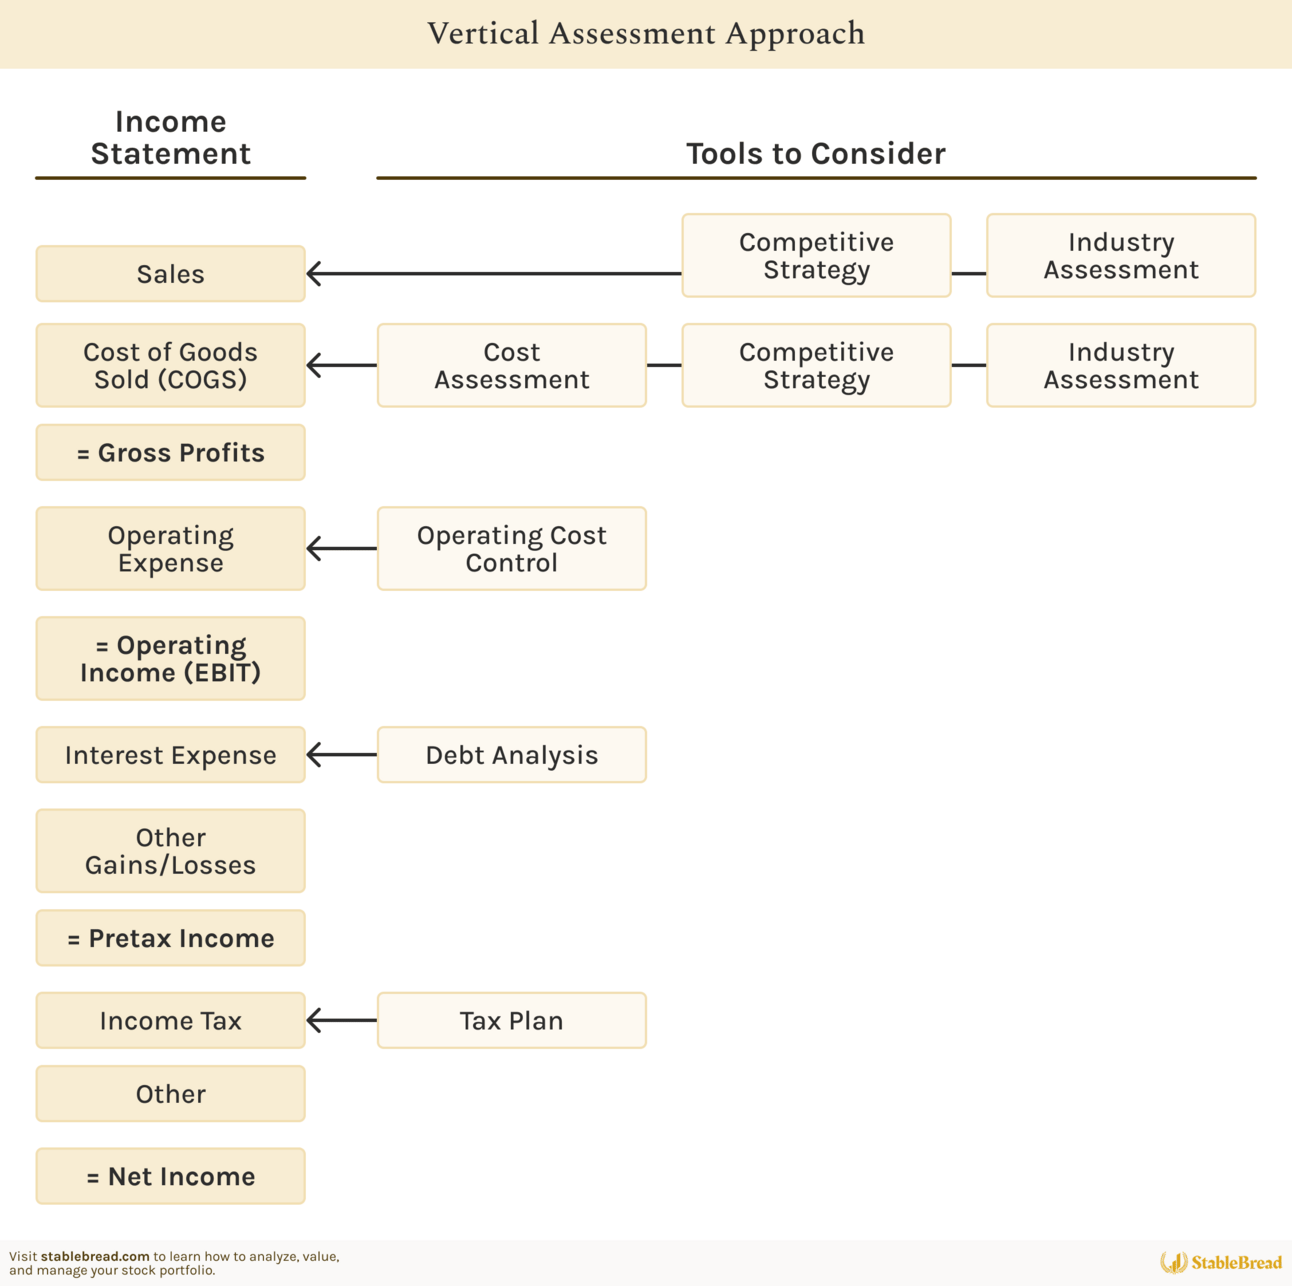
Jean-Jacques provides a visual framework showing how different assessment tools connect to specific line items on the income statement (which we recreated below):

Vertical Assessment Approach
Jean-Jacques identifies six specific tools for non-service (aka physical goods) companies:
Industry analysis
Competitive position analysis
Manufacturing cost assessment
Operating cost control
Debt analysis
Tax strategy assessment
Starting with sales at the top, investors work their way down through costs, expenses, and taxes to reach net income. Each assessment examines the economic forces affecting that particular line item, building a complete picture of what drives the company's performance.
Common-Size Analysis
Common-size statements express each line item as a percentage of sales, enabling comparison across different-sized companies. This analysis highlights which income statement areas deserve focus and uncovers margin strength and consistency.
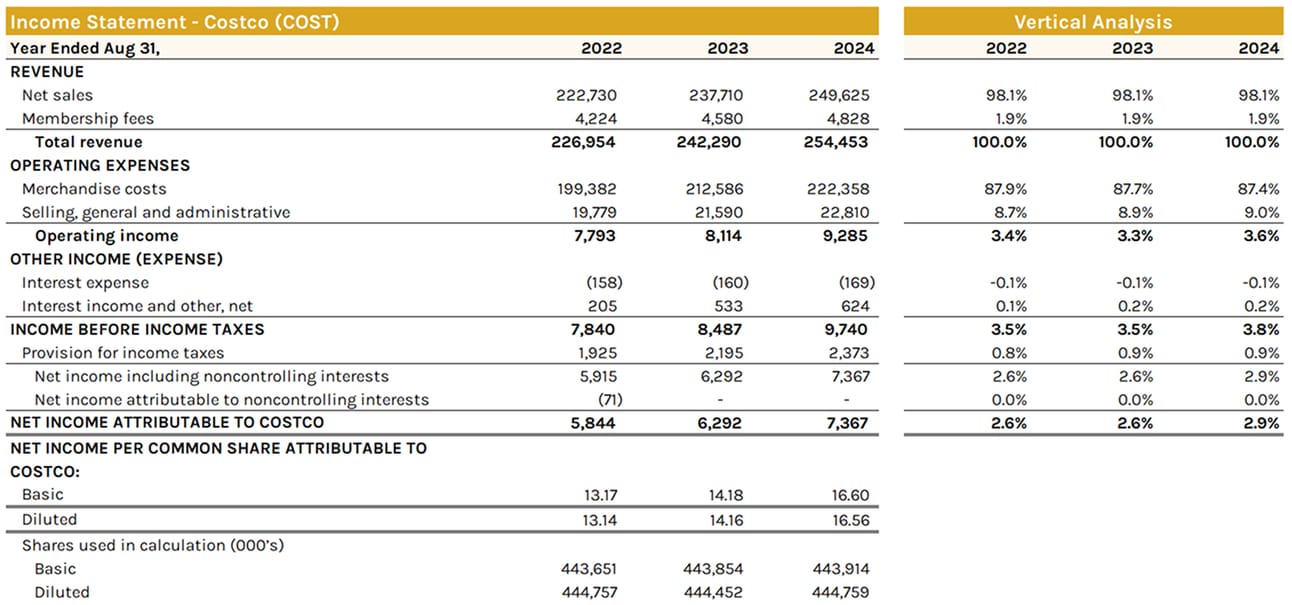
To provide an example, here’s a vertical analysis we performed on Costco ($COST ( ▼ 0.13% )):

Vertical Analysis ($COST)
As you can see, Costco has thin profit margins, typical of warehouse retailers who sacrifice profitability for volume. The company's cost structure, however, remains stable from year to year.
If Costco’s competitors, such as Walmart ($WMT ( ▲ 0.24% )) and Target ($TGT ( ▲ 0.66% )) offer stronger and faster growing margins, it could indicate the company is losing pricing power in the marketplace.
Jean-Jacques emphasizes that companies can deliver consistent earnings when the drivers of their sales remain secure and unthreatened.
A company that focuses on executing one particular strategy well, like Costco's low-margin, high-volume approach, can maintain stable performance over time. These consistent margins reflect sustainable competitive advantages rather than temporary conditions.
Revenue Recognition
Sales analysis begins with understanding how the company recognizes revenue. All publicly traded companies must use accrual accounting under GAAP or IFRS. This means companies record revenue when earned, not when cash changes hands.
The footnotes labeled "revenue recognition" explain how each company applies these accounting standards. While accrual accounting follows consistent principles, companies determine when control transfers to customers.
For physical products, this might occur at shipping or delivery. For services and subscriptions, companies recognize revenue over time as they fulfill obligations.
Reading these policies ensures meaningful comparisons between companies and helps investors distinguish accounting differences from operational performance.
Industry and Competitive Analysis
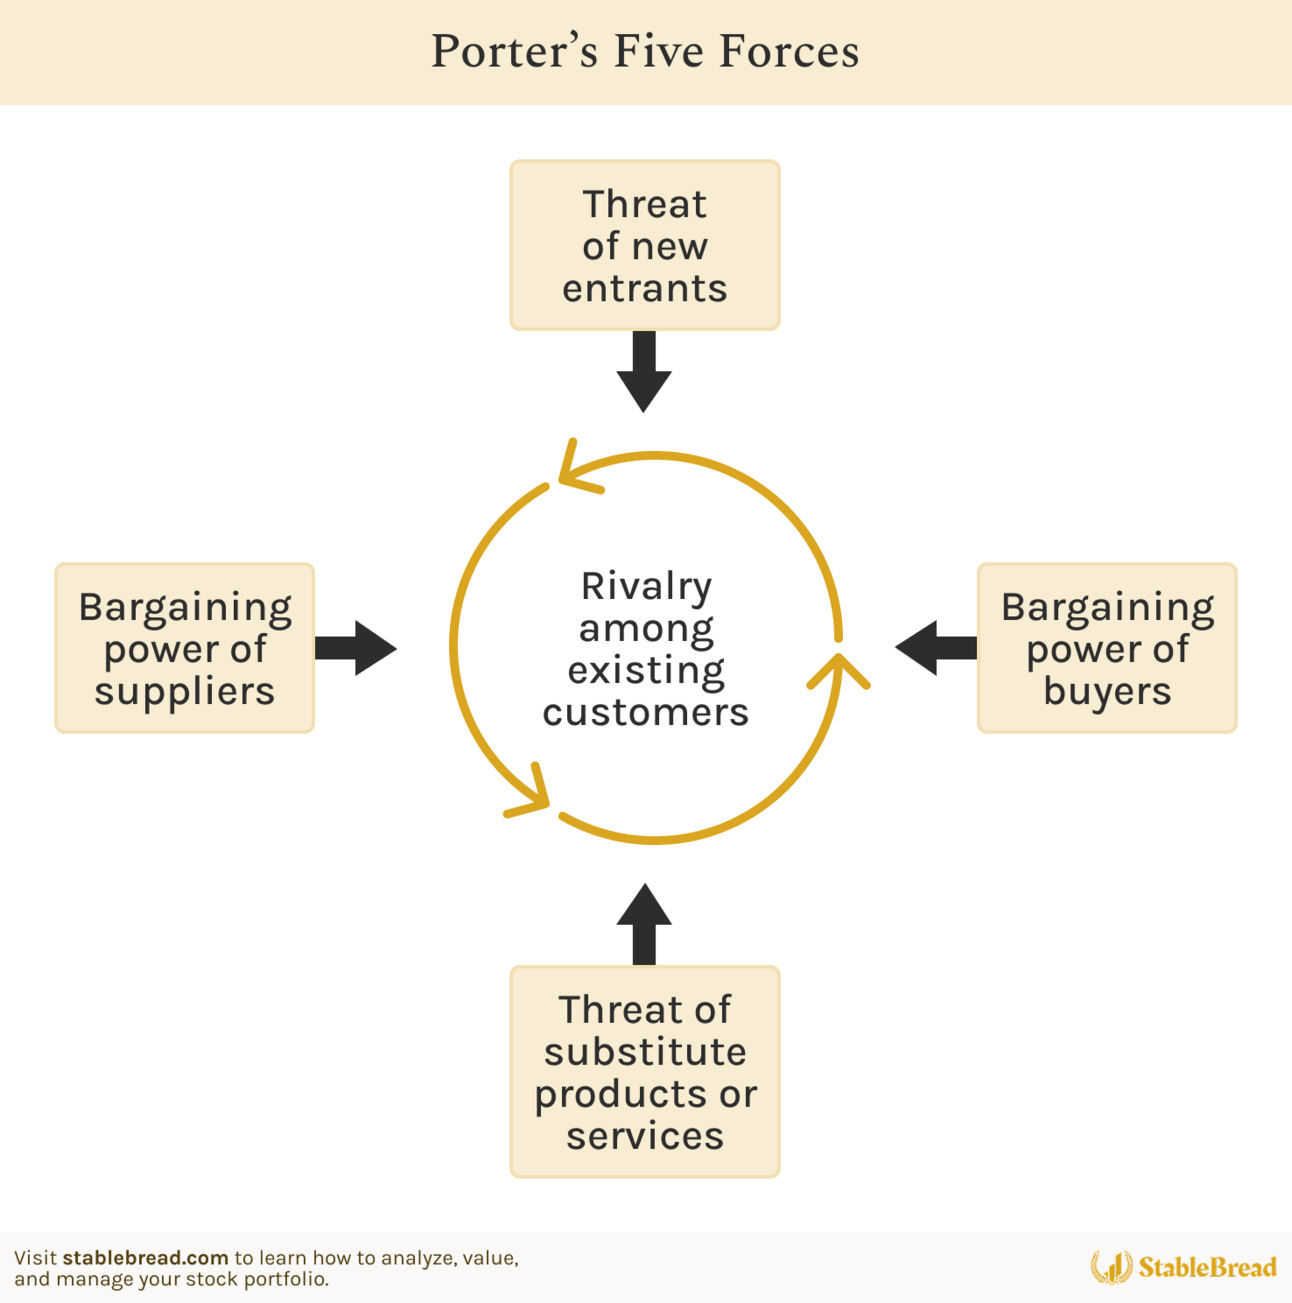
While some analysts use SWOT analysis (strengths, weaknesses, opportunities, threats) or rely on industry contacts to assess the competitive landscape, Michael Porter's five forces offers a more structured approach that examines the specific economic forces affecting an industry's profitability:

Porter’s Five Forces
Threat of new entrants: Low barriers to entry mean new competitors can easily enter and drive down prices, especially in industries with attractive margins.
Substitute products: Alternative solutions cap pricing power based on their performance and customers' willingness to switch.
Bargaining power of buyers: Price-sensitive customers with multiple options limit profitability.
Bargaining power of suppliers: Concentrated suppliers of critical components can squeeze margins.
Competitive rivalry: Fierce competition destabilizes pricing and industry profitability.
These forces directly impact sales through their effect on unit volume and price. Top-line growth depends on the combination of volume and price, while profitability depends on the relationship between price and production costs.
Porter identifies three strategies companies use to outperform competitors: (1) cost leadership, (2) differentiation, and (3) focus (concentrating on a specific market segment or geographic area).
He warns that pursuing multiple strategies dilutes resources:
"Effectively implementing any of these generic strategies usually requires total commitment and supporting organizational arrangements that are diluted if there is more than one primary target."
Companies that lose focus through acquisitions often destroy value. Peter Lynch called this "diworseification" and recommended avoiding such companies, though he acknowledged rare exceptions like Berkshire Hathaway that succeed through exceptional management.
Cost Structure Analysis
After understanding revenue drivers, the analysis moves to cost assessment. The objective is identifying which cost variables most impact a company's competitive advantage.
Cost of goods sold (COGS) includes three main components:
Manufacturing overhead: Indirect materials, labor, utilities, factory buildings, etc.
Direct materials: Components that become part of the finished product.
Direct labor: Assembly line workers who physically touch the product.
Investors should analyze these costs as percentages of sales over time. Rising COGS percentages signal deteriorating competitive position or operational problems. Falling percentages suggest improving efficiency or pricing power.
Operating expenses come next, determined largely by competitive strategy and overhead management. Selling expenses relate to marketing and distribution, while administrative expenses cover running the company.
A differentiation strategy typically requires higher selling expenses, but should generate correspondingly higher margins.
Interest Expense and Debt Assessment
Interest expense reflects the company's debt burden. Jean-Jacques notes that moderate debt serves a positive purpose through "the discipline of debt," preventing management from wasteful acquisitions.
The challenge lies in finding the right amount that provides discipline without creating financial distress.
Two ratios help evaluate appropriate debt levels:
Interest Coverage Ratio
The interest coverage ratio measures whether a company generates enough cash to comfortably pay its debt obligations. Companies with strong coverage can weather economic downturns, while those with weak coverage risk default during difficult periods:
Interest Coverage Ratio = EBIT / Interest Expense
A ratio of 1.0 means the company barely covers interest payments. Ratios above 2.0 provide breathing room, while those below 1.0 signal distress.
Debt-to-Capitalization Ratio
The debt-to-capitalization ratio indicates how aggressively a company uses borrowed money to finance operations. This balance between debt and equity affects both returns and risk:
Debt-to-Capitalization Ratio = Total Debt / Total Capital
Appropriate levels vary by industry, with stable businesses able to support more debt than cyclical ones. Industry leaders often provide benchmarks for reasonable leverage ratios.
Tax Strategy and Other Income Items
Tax planning determines final returns to shareholders. Companies dedicate substantial resources to legally minimizing taxes. The tax footnotes explain current strategies, their financial impact, and sustainability.
Investors should determine whether low tax rates result from permanent advantages or temporary benefits about to expire.
Other gains and losses include asset value changes from non-operating transactions. These one-time items should be separated from ongoing business performance.

ROE Decomposition Approach
Return on equity (ROE) results from a company's competitive position in its industry, the operating strategies it employs, and the financial flexibility it possesses.
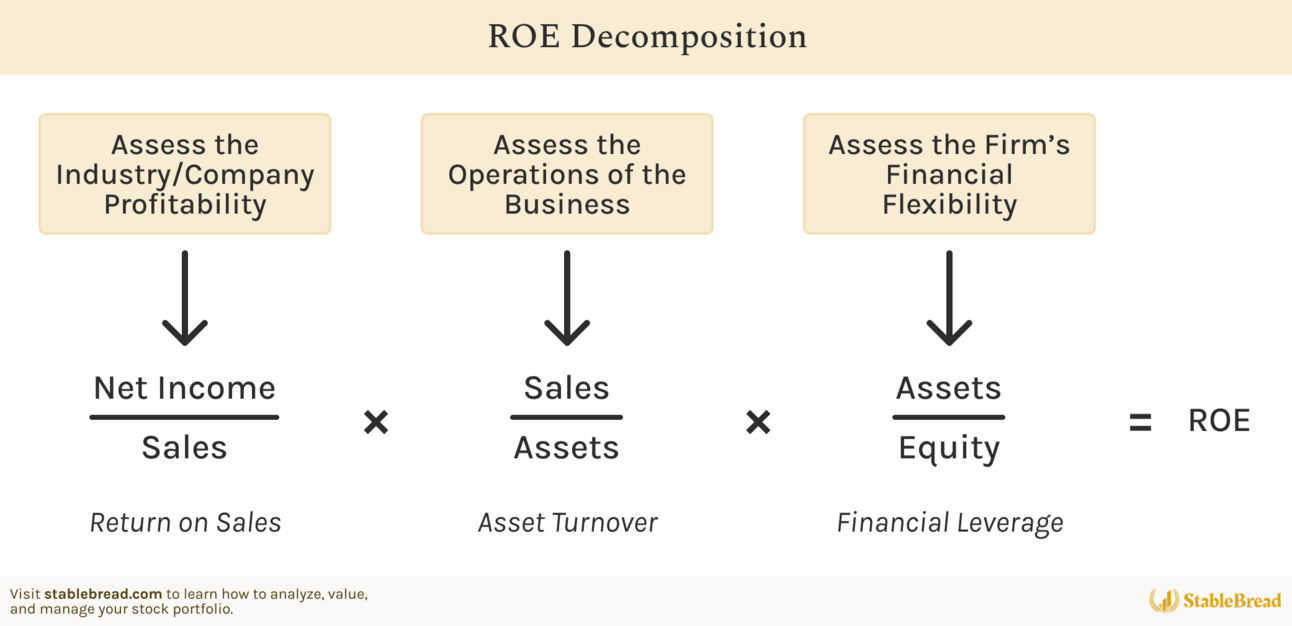
The ROE decomposition approach, also known as the duPont Model, highlights how profitably management allocates the firm's resources. By breaking ROE into three components, investors can understand exactly where a company's returns come from:

ROE Decomposition
Here’s the formula again, for your reference:
ROE = Net Profit Margin × Asset Turnover × Financial Leverage
—> (Net Income / Sales) × (Sales / Assets) × (Assets / Equity)
Each component tells a different story about the business.
The Three Components
Net Profit Margin
Net profit margin measures profitability, showing how much profit the company keeps from each dollar of sales.
Net Profit Margin = Net Income / Sales
A 10% margin means the company keeps 10 cents of every sales dollar after all expenses.
High margins suggest competitive advantages like brand power, patents, or unique capabilities that allow premium pricing. Low margins indicate commodity businesses competing mainly on price.
Asset Turnover
Asset turnover measures efficiency, showing how much revenue the company generates per dollar of assets.
Asset Turnover = Sales / Assets
A ratio of 2.0 means the company produces $2 in sales for every $1 of assets employed.
Asset-light businesses like software companies typically show high turnover ratios because they need minimal physical assets. Capital-intensive businesses like utilities show low ratios due to massive infrastructure investments.
Financial Leverage
Financial leverage shows how much the company amplifies returns through debt financing.
Financial Leverage = Assets / Equity
A leverage ratio of 2.0 means the company uses $2 of assets for every $1 of equity.
Leverage magnifies both profits and losses. In good times, borrowed money increases returns to shareholders. In bad times, debt obligations remain fixed while revenues fall, potentially threatening solvency.
Paths to Higher ROE
Companies can increase ROE through any of its three components, but each path carries different risks and requirements:
Improving margins requires competitive advantages or operational excellence
Increasing asset turnover demands efficient operations and working capital management
Adding leverage provides quick results but increases financial risk
The best businesses generate high ROEs through strong margins and efficient operations rather than excessive leverage. Companies relying primarily on debt to boost returns often struggle during economic downturns when debt obligations remain fixed while revenues fall.
Trends matter more than the numbers themselves. Expanding margins signal strengthening competitive position or improving efficiency. Contracting margins warn of rising competition or operational problems.
Similarly, within an industry, higher asset turnover indicates better management through superior capacity utilization, inventory management, or customer relationships.
Industry Context
ROE analysis requires industry context. A 15% ROE might be excellent for a utility but mediocre for a software company. Investors should compare companies to industry peers while examining whether high returns will attract new competition.
Sustainable high ROEs typically come from businesses with competitive moats. These include network effects, switching costs, intangible assets, or cost advantages that competitors cannot easily replicate.
Without such protection, high returns eventually attract competition that drives down profitability.

Cash-Flow-Based Approach
Cash flow analysis shows the quality of reported earnings and the actual cash-generating ability of a business. While accounting profits can be manipulated through various techniques, cash flows provide a clearer picture of economic reality.
Types of Cash Flow
The investment community uses several cash flow definitions, with three being most common:
Net Cash Flows
This basic measure starts with net income and adds back non-cash charges like depreciation and amortization (D&A). The calculation attempts to show cash generated by operations:
Net Cash Flow = Net Income + D&A + Other Non-Cash Items
However, this measure assumes working capital remains constant, which rarely happens in growing businesses. Companies typically need more inventory and receivables as they expand, consuming cash despite profitable growth.
Operating Cash Flow
The cash flow statement's operating section provides a more complete picture by including working capital changes. This shows actual cash generated after funding day-to-day operations:
Operating Cash Flow = Net Income + D&A + Other Non-Cash Items + Changes in Working Capital
A company reporting $100M in profits might generate only $60M in operating cash if it invested $40M in additional inventory and receivables. Conversely, a company collecting old receivables might show cash flow exceeding reported profits.
This measure shows whether profits translate into actual cash or remain tied up in business operations.
Discounted Cash Flow
The discounted cash flow (DCF) calculates the present value of future cash flows. This approach serves primarily as a valuation tool rather than for business assessment.
Reading the Cash Flow Statement
The cash flow statement divides activities into three sections that tell the story of how a company generates and uses cash:
Operating activities: Cash from core business operations. Strong companies generate substantial operating cash flows that fund other activities.
Investing activities: Capital expenditures and acquisitions. Maintenance capex roughly equals depreciation, while growth investments exceed it.
Financing activities: Debt and equity transactions. Mature companies should return cash through dividends and buybacks rather than constantly raising capital.
The relationship between these sections tells a company's financial story.
A healthy mature business has positive operating flows that fund moderate investing needs and return excess cash to shareholders. In contrast, a struggling company displays negative operating flows covered by asset sales and new financing.
Growth companies might show negative investing flows funded by strong operations, indicating healthy expansion.
Free Cash Flow
Value investors focus most on free cash flow (FCF), which represents cash available for distribution to shareholders after maintaining and growing the business:
Free Cash Flow = Net Income + D&A - CapEx - Working Capital Increases
This figure tells investors whether a company truly creates value or merely consumes capital to sustain operations. A business reporting profits but negative free cash flow destroys value by requiring constant capital infusions.
Evaluating Cash Flow Quality
When analyzing cash flow trends, investors should ask the following questions:
What is the relative strength of the company's internal cash flow compared to its peers?
Can the company continue to meet its short-term financial obligations without reducing the firm's financial flexibility?
What is the trend and use of free cash flow?
What type of external financing does the company rely on, and does it affect the company's risk profile?
Companies that answer favorably to all four questions typically generate sustainable cash returns for shareholders, while those requiring constant external financing often destroy value over time.

Thanks for Reading!

